. 2022 Dec 7;11:e76383. doi: 10.7554/eLife.76383

Figure 2. Benchmarking performance across a range of study designs.

Values represent the average of three independent trials. FDR: False Discovery Rate; TPR: True Positive Rate. For phasing and imputation, gray indicates that no hetSNPs remained after downsampling. For meiotic recombination discovery, gray indicates the absence of a prediction class (e.g., zero FNs, FPs, TNs, or TPs). Simulations roughly matching the characteristics of the Sperm-seq data are outlined in red.
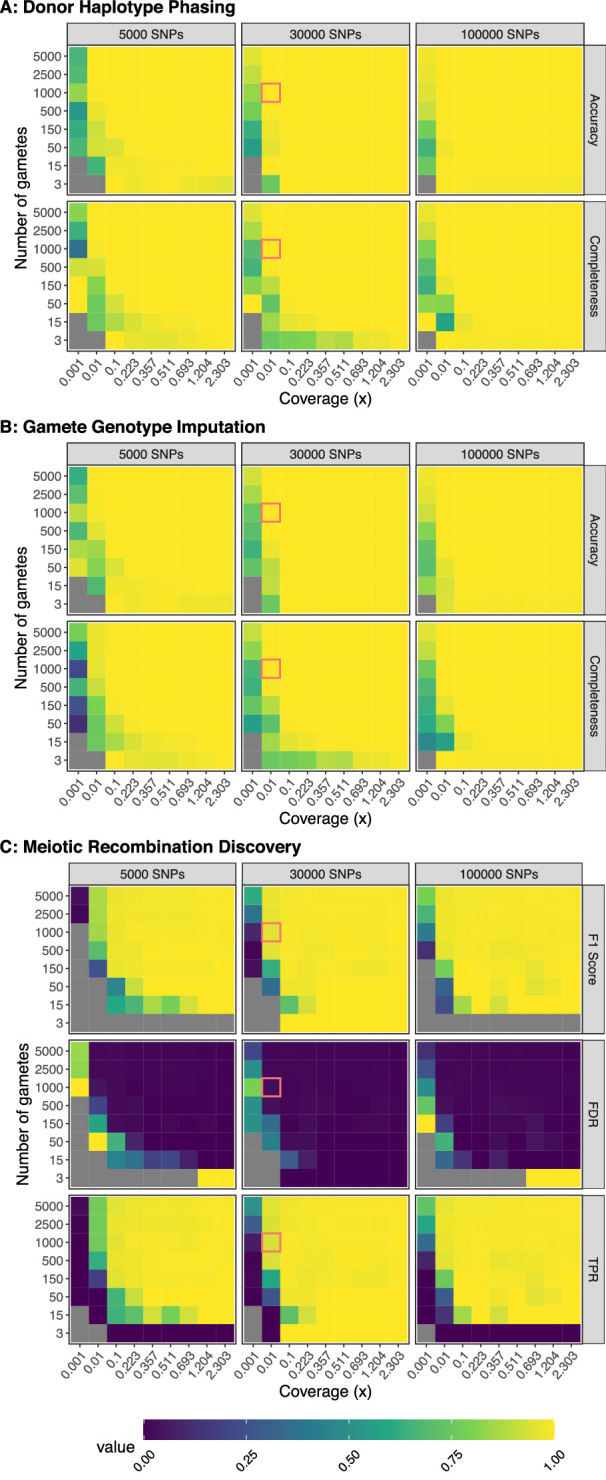
Figure 2.

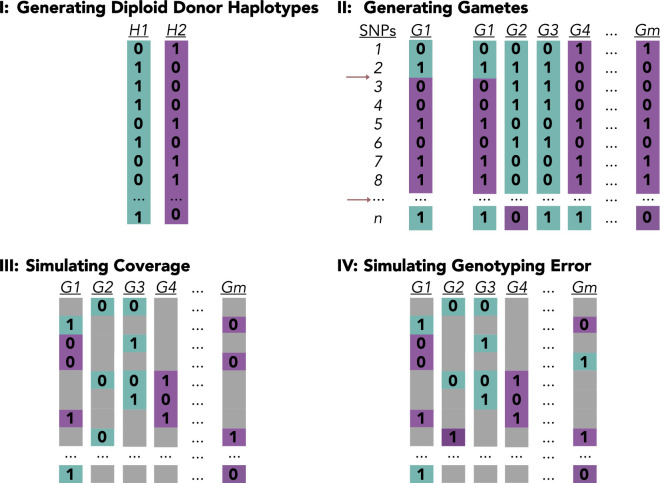
Figure 2—figure supplement 1. Generative model.

Figure 2—figure supplement 1.

(I) The first step of the generative model builds the phased haplotypes of the diploid donor, with n hetSNPs. (II) In the second step, gamete genotypes are derived from the diploid donor haplotypes by simulating meiotic recombination events, repeating the process for all gametes, {1, …, m}. (III) In the third step, low-coverage sequencing data is generated by removing genotypes from a copy of the gamete genotype matrix. (IV) In the final step, genotyping error is simulated by randomly replacing a small fraction of genotypes with the opposite allele.
Figure 2—figure supplement 2. Benchmarking performance across a range of study designs - Additional Metrics.
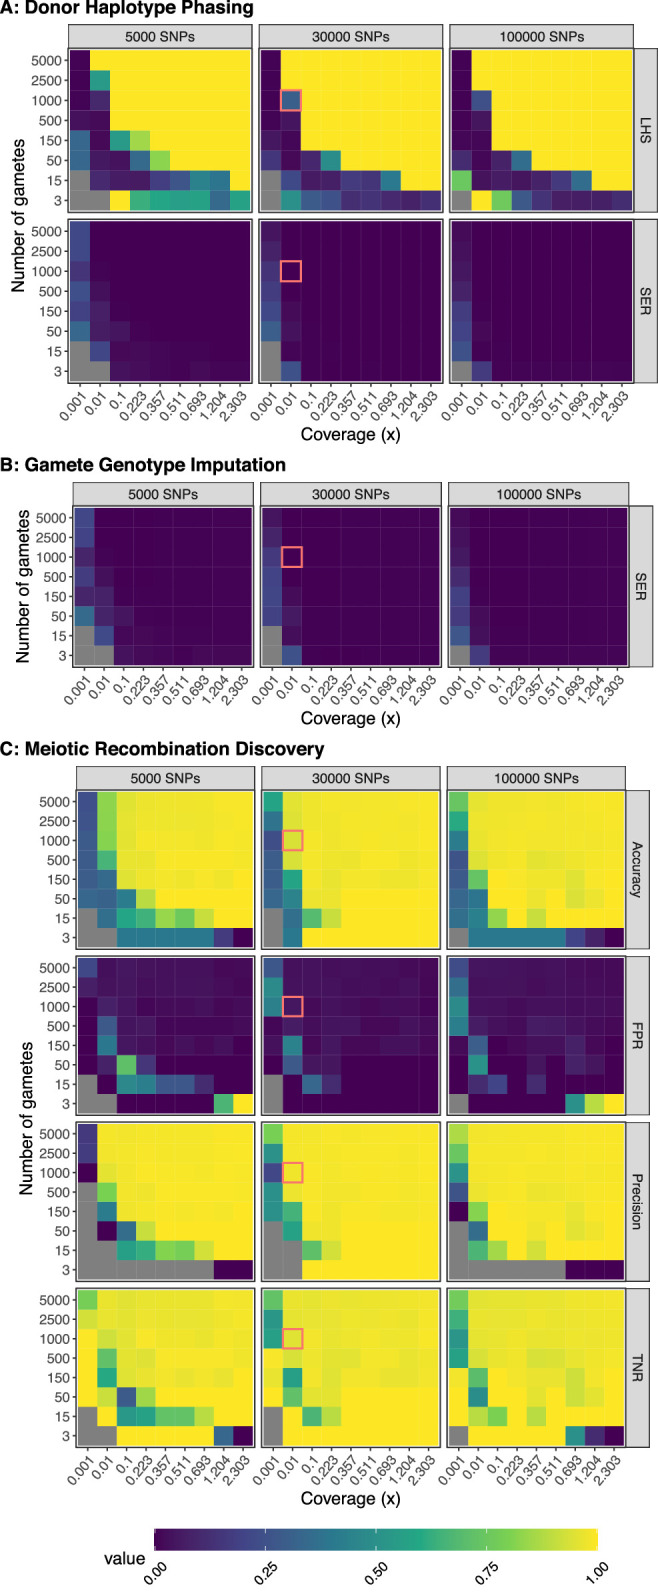
Figure 2—figure supplement 2.

Input data were created from the generative model and analyzed with rhapsodi. For all data in this figure, the genotyping error and recombination rates were matched between models. Each value is the average of three independent trials. LHS: Largest Haplotype Segment (as ratio of segment length / total hetSNPs); SER: Switch Error Rate; FPR: False Positive Rate; TNR: True Negative Rate.
Figure 2—figure supplement 3. Illustration of switch error rate (SER) and accuracy.

Figure 2—figure supplement 3.

The top row shows the true haplotypes of a given chromosome and the bottom row shows the inferred haplotypes. Purple denotes alleles assigned to one haplotype and teal alleles to the other. The example chromosome is 60 hetSNPs long. Switch errors occur at two positions, demarcated by the red boxes. The switch error rate is calculated as the number of first mismatches (i.e., number of red boxes) divided by the total length of the chromosome. Therefore, the SER for this gamete would be 2/60 or 3.3%. In contrast, the accuracy considers all matching positions (i.e., one minus the length of the red boxes) in the numerator: 1 - (15/60) or 75%.
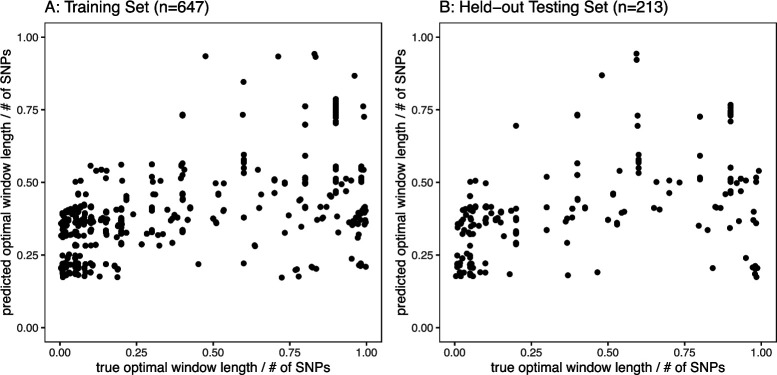
Figure 2—figure supplement 4. Automatic phasing window size calculation.

Figure 2—figure supplement 4.

A beta regression model relating optimal phasing window size (represented as window size / of SNPs) to number of gametes, coverage, genotyping error rate, and recombination rate was fit on the training data and applied to the held-out test set. The number of gametes, coverage, and recombination rate were significantly associated with optimal window size. The model performed well with both the training and test sets, with no obvious loss when generalizing to new data. This model is implemented as an optional feature for automatic phasing window size calculation, given the input data parameters, within the rhapsodi software package.
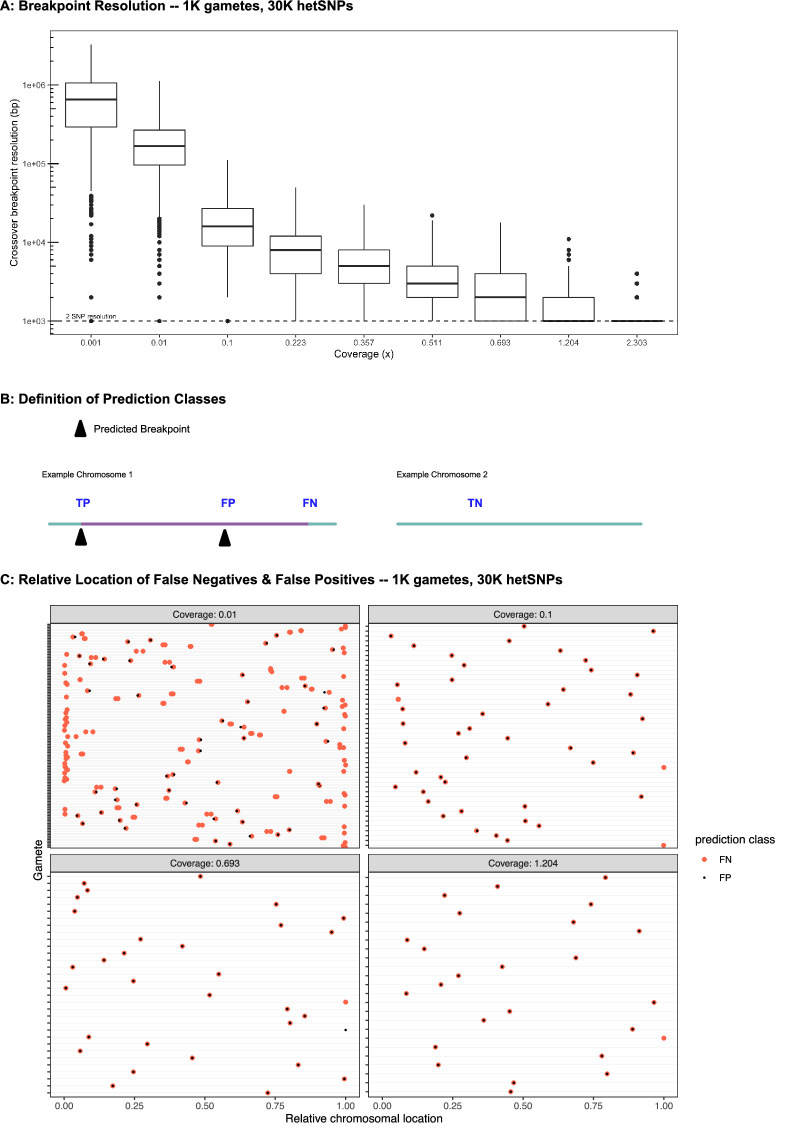
Figure 2—figure supplement 5. Discovery of meiotic recombination events in simulated data reflecting characteristics of the Sperm-seq data.

Figure 2—figure supplement 5.

(A) Breakpoint resolution stratified by depth of coverage. Resolution is scaled to base pairs assuming pairwise nucleotide diversity of 0.001 (i.e., one hetSNP per 1000 bp). The minimum possible resolution of 2 hetSNPs is denoted with a dashed line. (B) Definition of prediction classes. True positive (TP); True negative (TN); False positive (FP); & False negative (FN). Colors reflect the donor haplotypes, and transitions between these colors indicate recombination events. (C) Relative locations of FN & FP breakpoints within gametes from selected, simulated coverages. Each row in each panel represents an individual gamete with at least one FN or FP. Pairs of FPs and FNs is owed to slight displacement of the inferred crossover breakpoint, which may arise by consequence of premature or delayed switching behaviors of the HMM.
Figure 2—figure supplement 6. Model robustness when genotyping error is underestimated.
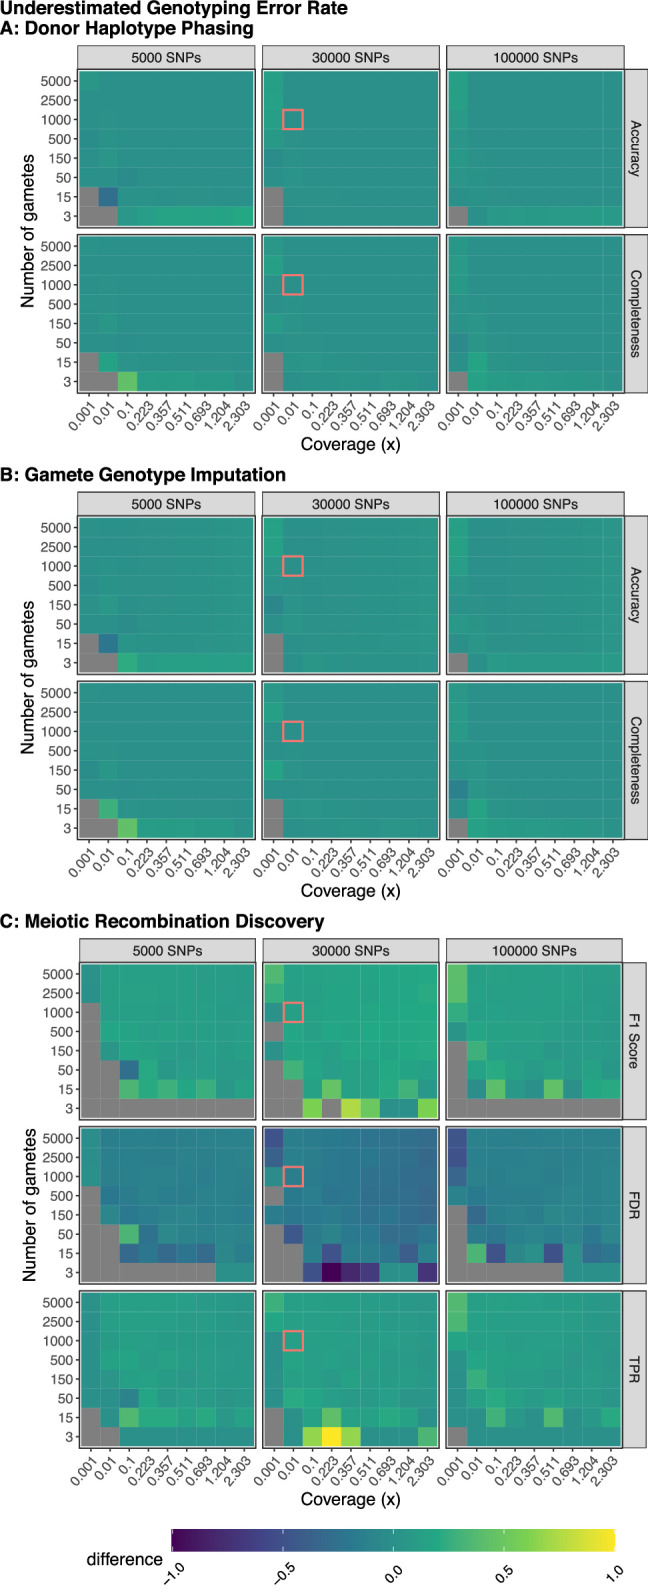
Figure 2—figure supplement 6.

Plotted values are the difference between the mean performance (across three independent trials) when the generative model and rhapsodi use the same parameters (Figure 2) and the mean performance (across three independent trials) when the rhapsodi genotyping error (0.005) is underestimated compared to the rate used by the generative model (0.05). The average recombination rate is 1 per chromosome in both models.
Figure 2—figure supplement 7. Model robustness when recombination rate is underestimated.
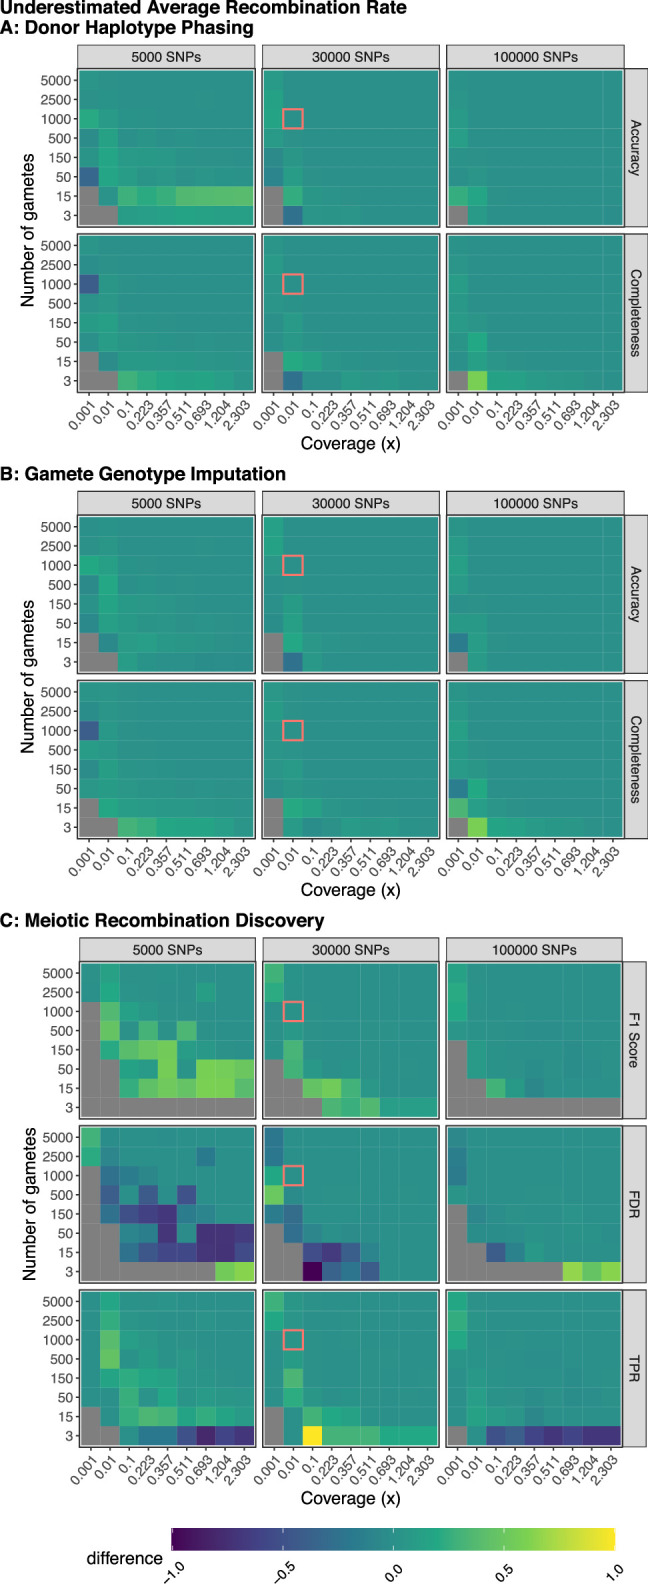
Figure 2—figure supplement 7.

Plotted values are the difference between the mean performance (across 3 independent trials) when the generative model and rhapsodi use the same parameters (Figure 2) and the mean performance (across three independent trials) when the rhapsodi recombination rate (1) is underestimated compared to the rate used by the generative model (3). The genotyping error rate is 0.005 in both models.
Figure 2—figure supplement 8. Model robustness when genotyping error is overestimated.
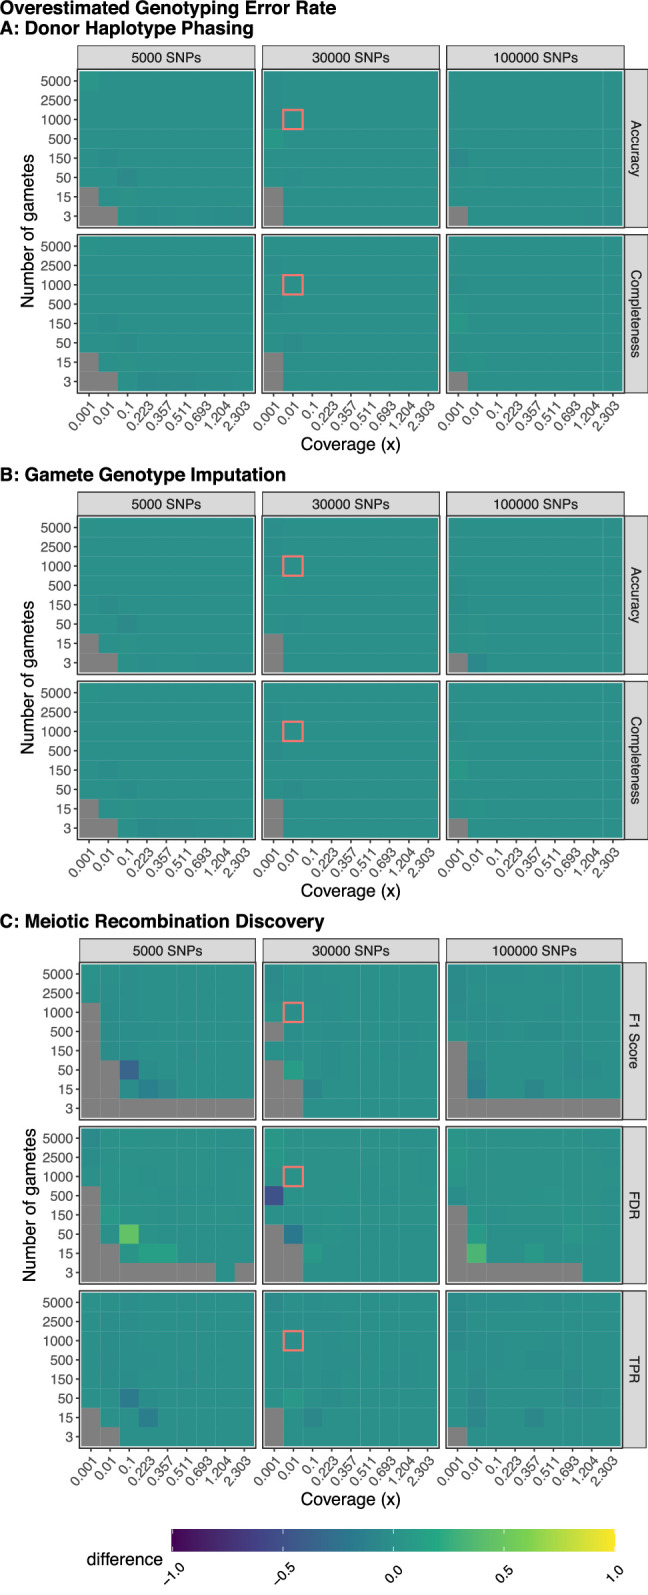
Figure 2—figure supplement 8.

Plotted values are the difference between the mean performance (across three independent trials) when the generative model and rhapsodi use the same parameters (Figure 2) and the mean performance (across three independent trials) when the rhapsodi genotyping error rate (0.005) is overestimated compared to the rate used by the generative model (0.001). The average recombination rate is 1 per chromosome in both models.
Figure 2—figure supplement 9. Model robustness when recombination rate is overestimated.
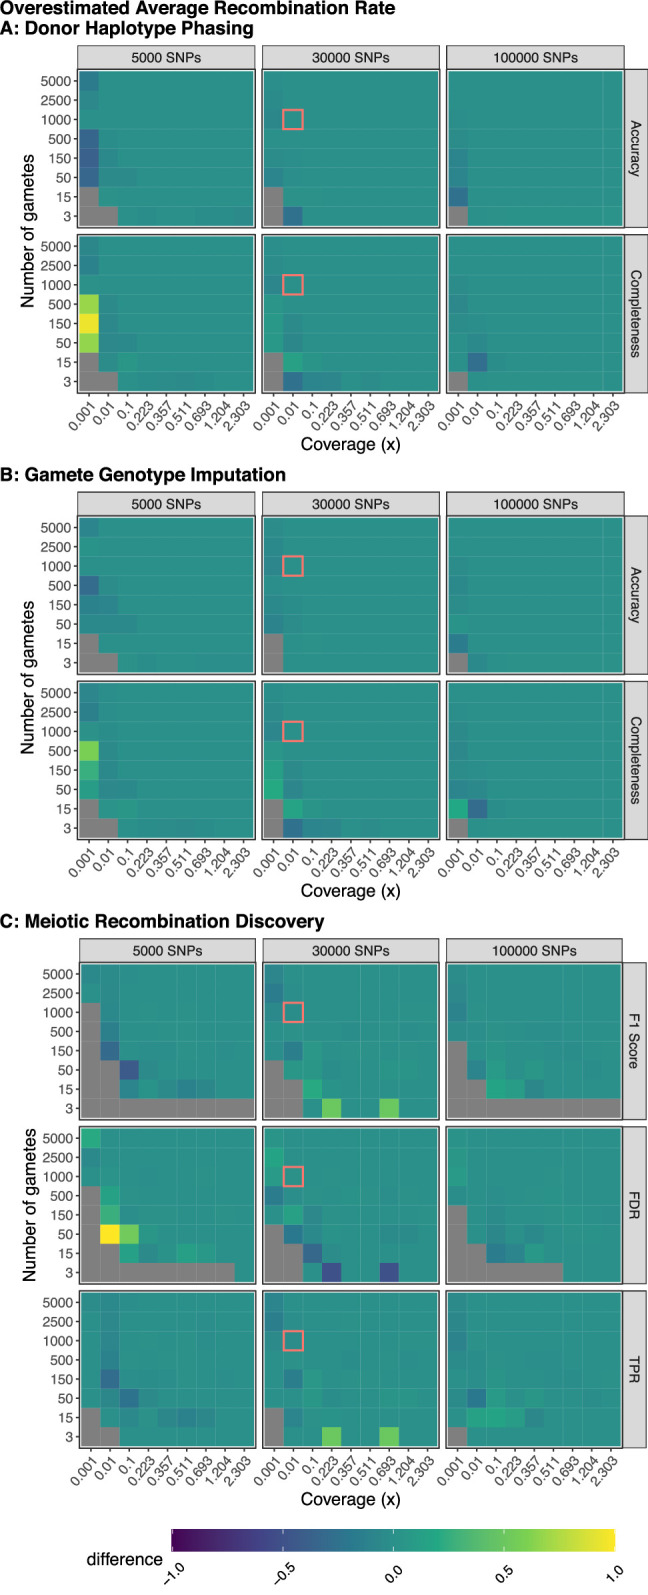
Figure 2—figure supplement 9.

Plotted values are the difference between the mean performance (across three independent trials) when the generative model and rhapsodi use the same parameters (Figure 2) and the mean performance (across three independent trials) when the rhapsodi recombination rate (1) is overestimated compared to the rate used by the generative model (0.6). The genotyping error rate is 0.005 in both models.
Figure 2—figure supplement 10. Benchmarking rhapsodi runtime across a range of simulated data profiles.
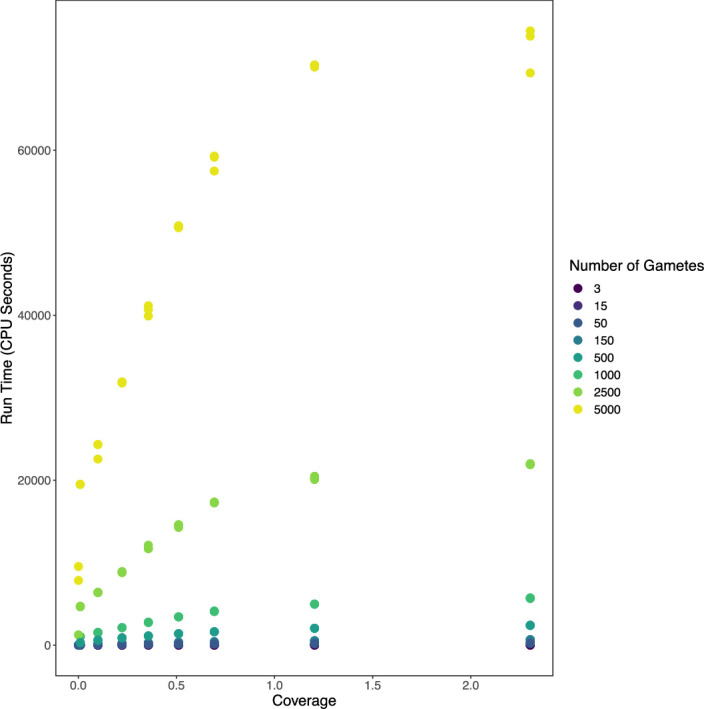
Figure 2—figure supplement 10.

We generated sperm-seq datasets with 100,000 SNPs and varied coverages and numbers of gametes. We measured runtime of rhapsodi analysis using the rhapsodi_autorun function. Reported time is in CPU seconds, or the combined runtime of all CPUs involved in computation.