. 2022 Dec 7;11:e76383. doi: 10.7554/eLife.76383

Figure 4. Simulation demonstrating power to detect deviations from binomial expectations across sample sizes of sperm, without (A) and with (B) multiple hypothesis testing correction.

For each combination of transmission rate and number of gametes, power was calculated based on 1000 independent simulations and assuming full knowledge of gamete genotypes. Panel A uses the standard α = 0.05, while panel B uses an adjusted p-value threshold of 1.78 x 10⁻⁷ as employed in our study. Note that this correction is conservative in that it adjusts for multiple testing across the genome as well as across donor individuals. Red arrows indicate gamete sample sizes roughly matching the Sperm-seq data (average n = 1711 sperm cells per donor).

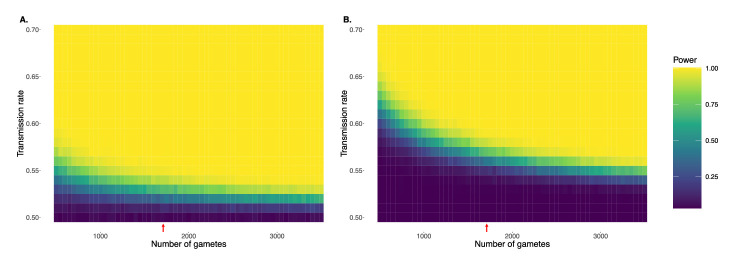
Figure 4.

Figure 4—figure supplement 1. Simulation demonstrating power to detect deviations from binomial expectations across sample sizes of sperm cells, without (A) and with (B) multiple hypothesis testing correction.

Figure 4—figure supplement 1.

For each combination of transmission rate and number of gametes, power was calculated based on 1000 independent simulations and assuming full knowledge of gamete genotypes. Panel A uses the standard alpha = 0.05, while panel B uses an adjusted p-value threshold of 1.78 x 10⁻⁷ as employed in our study. Note that this correction is conservative in that it adjusts for multiple testing across the genome as well as across donor individuals. Red arrows indicate gamete sample sizes roughly matching the Sperm-seq data (average n = 1711 sperm cells per donor).
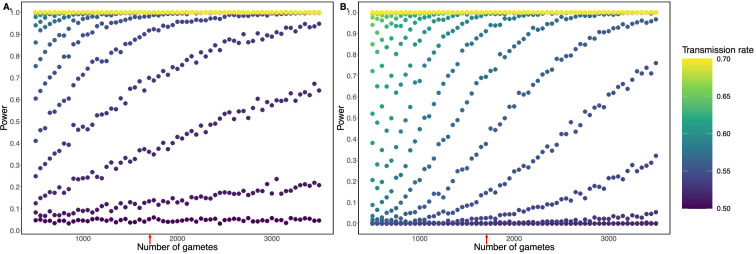
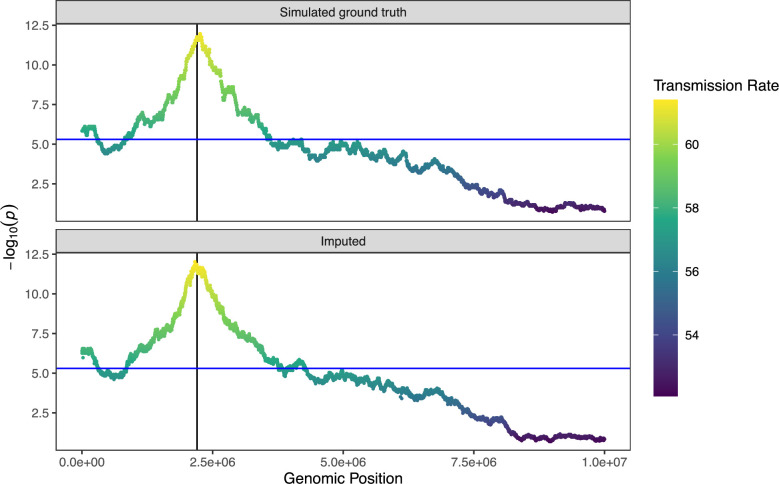
Figure 4—figure supplement 2. Simulated signature of transmission distortion.

Figure 4—figure supplement 2.

We simulated 1000 gametes with 10,000 SNPs. We generated TD by choosing an allele at random and removing 30% of gametes which carried that allele. We simulated coverage of 0.01× and genotyping error rate of 0.005 and then imputed gamete genotypes using rhapsodi. Top and bottom panels show results of testing for transmission distortion on simulated ground truth and imputed data, respectively.
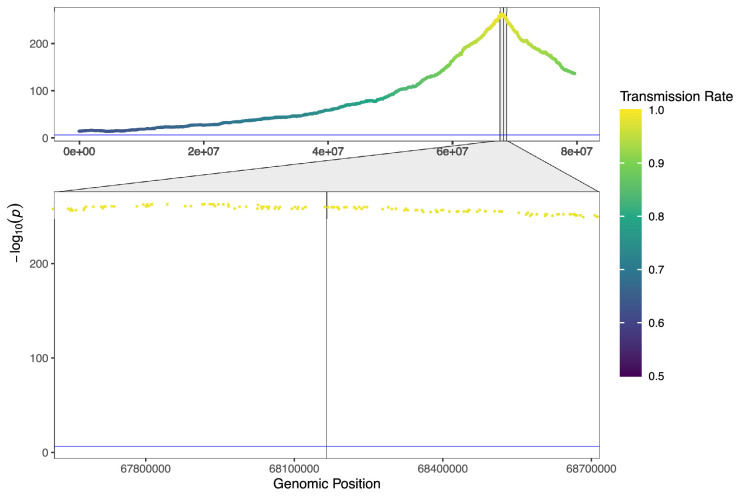
Figure 4—figure supplement 3. Simulated signature of strong (k=0.99) transmission distortion.

Figure 4—figure supplement 3.

We simulated data with 974 gametes, 79,630 SNPs, and 0.0075× coverage, corresponding to the data profile of donor NC26 chromosome 8. Zooming in to region surrounding the causal SNP (denoted with the black, vertical line), we observe that the causal SNP and several flanking SNPs were filtered out due to apparent homozygosity across the sample of sperm cells. However, the imputed gamete genotypes still exhibit signal of the strong TD on either side of this region, far below the p-value threshold of genome-wide significance.
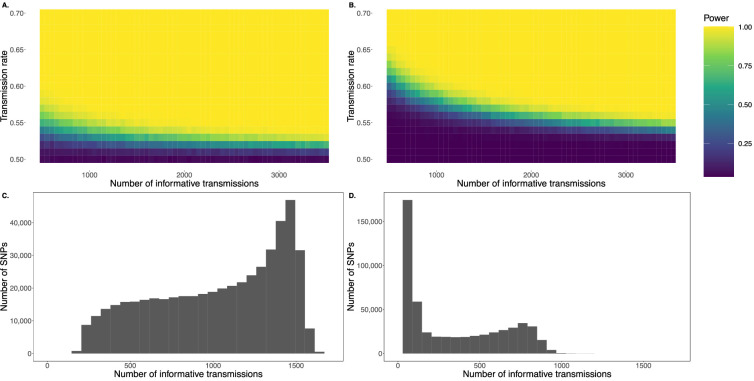
Figure 4—figure supplement 4. Simulation demonstrating power to detect deviations from expectations using the transmission disequilibrium test (TDT), as applied to human pedigree studies, without (A) and with (B) multiple testing correction (alpha = 0.05 and 10-7, respectively).

Figure 4—figure supplement 4.

The latter threshold is the standard for genome-wide significance (10-7) used in past studies (Meyer et al., 2012). The sample size refers to the number of informative transmissions, where each trio with a parent heterozygous for the SNP of interest has one informative transmission of the given SNP. Power was calculated based on 1000 independent simulations. Panels C and D show the distributions of the number of informative transmissions per SNP from the two pedigrees in Meyer et al., 2012 for which data were publicly available: AGRE (C) and HUTT (D). Meyer et al., 2012 removed SNPs with fewer than 200 informative transmissions in AGRE and fewer than 50 informative transmissions in HUTT prior to their analysis. Note that the number of informative transmissions is typically substantially less than the total number of offspring in each pedigree (after quality control and sample size cutoffs, 1518 for AGRE and 848 for HUTT).