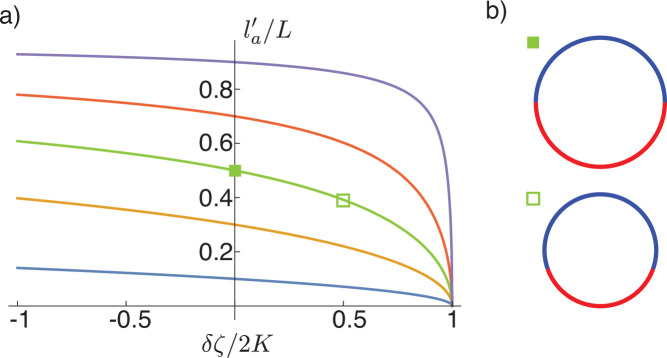
Appendix 8—figure 1. Rescaling of the size of the active region with active tension difference.
(a) Plot of as given by Equations 213; 214. This illustrates the rescaling of the active region size as a function of the tension difference , for initial values (blue to purple). (b) Shapes corresponding to two points on the curve.

