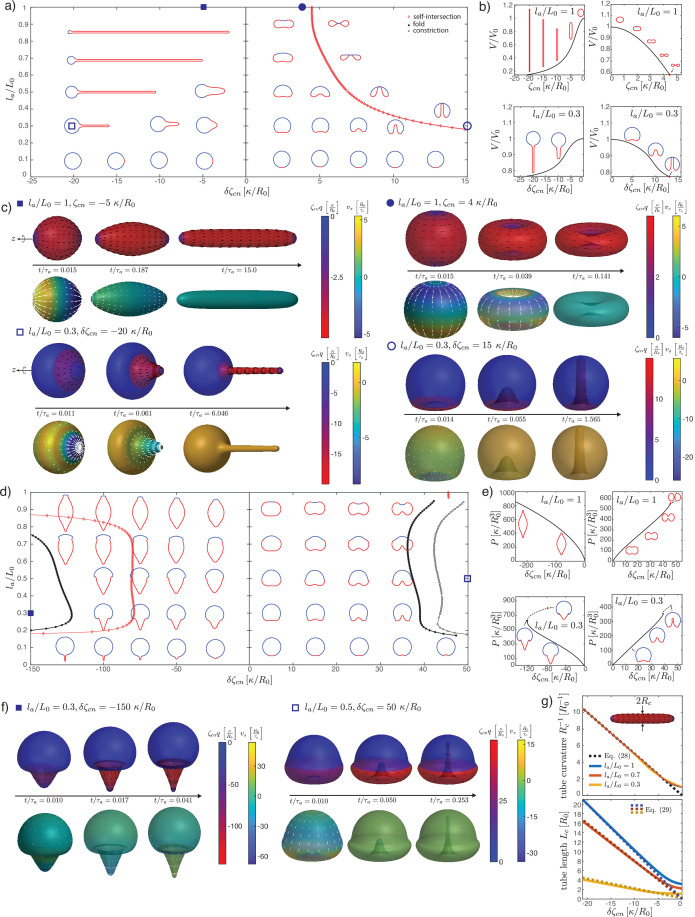
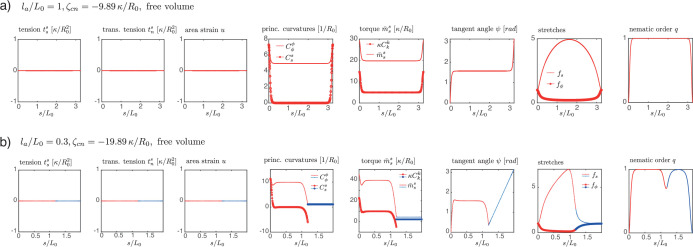
Figure 5. Deformations of epithelial shells due to nematic bending moments, with free (a–c) and conserved (d, e) volume.
(a, d) Shape diagrams. (b, e) Details of shape diagram illustrating the behaviour of solution branches. (c, f) Dynamic simulations of shell shape changes, for parameter values indicated in the phase diagrams (a, d). In both cases in (f) the dynamics results in self-intersection. (g) Comparison of curvature and length of the cylindrical tubes for , with analytical predictions. The tube length is measured on the steady-state shape as the arc length of the deformed active region, , and the tube curvature as . Other parameters: , , . In (c), (f), for the orientation of the director field drawn on the surface (black lines) is set by .


