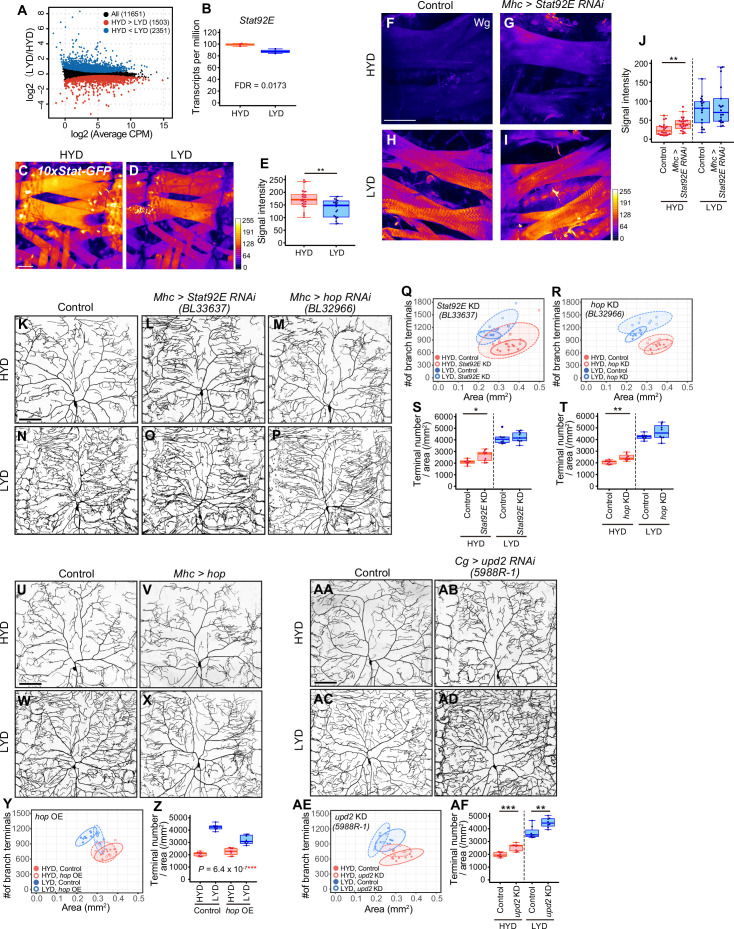
Figure 5. Downregulation of Wg expression by Stat92E on HYD suppresses the hyperarborization phenotype.
(A and B) Plots of whole-body RNA-seq of wandering 3rd instar larvae reared on HYD or LYD. (A) The fold change (LYD/HYD) in read counts was plotted against average counts per million mapped reads (CPM) for HYD and LYD. Dots that are statistically supported (FDR ≤0.05) are colored (red for HYD >LYD and blue for HYD <LYD). (B) Plot of transcripts per million (TPM) of Stat92E. Adjusted p-value with Benjamini & Hochberg correction (FDR) is indicated. (C–E) Muscles of 10 x Stat-GFP larvae on HYD (C) or LYD (D). The signal intensities of GFP correspond to the indicated color code. (E) Quantification of 10 x Stat-GFP intensity in muscle 9 (Student’s t-test, n=20–27). (F–J) Muscles of control larvae (F and H) or larvae with Stat92E KD in muscles (G and I) on HYD or LYD were stained for Wg. The signal intensities correspond to the indicated color code. (J) Quantification of the mean Wg immunofluorescence in muscle 9 (Wilcoxon-Mann-Whitney test, n=17–22). (K–T) Images of ddaC neurons in control larvae (K and N), larvae with Stat92E KD in muscles (L and O), or larvae with hop KD in muscles (M and P), on HYD or LYD. 2D plots (Q and R) and densities of branch terminals (S and T, Wilcoxon-Mann-Whitney test, n=8–9). (U–Z) Images of ddaC neurons in control larvae (U and W) or larvae with hop overexpression in muscles (V and X), on HYD or LYD. 2D plot (Y) and densities of branch terminals (Z, two-way ANOVA, n=8). (AA-AF) Images of ddaC neurons in control larvae (AA and AC) or larvae with upd2 KD in the fat body and hemocytes (AB and AD), raised on HYD or LYD. 2D plot (AE) and densities of branch terminals (AF, Wilcoxon-Mann-Whitney test, n=8). The ddaC neurons were visualized by expressing ppk-CD4:tdGFP. Control data in (R) and (T) are shared with (Y) and (Z). Boxplots in (B, E, J, S, T, Z and AF) are depicted as in Figure 1C. *p<0.05, **p<0.01, and ***p<0.001. Scale bars, 100 μm.
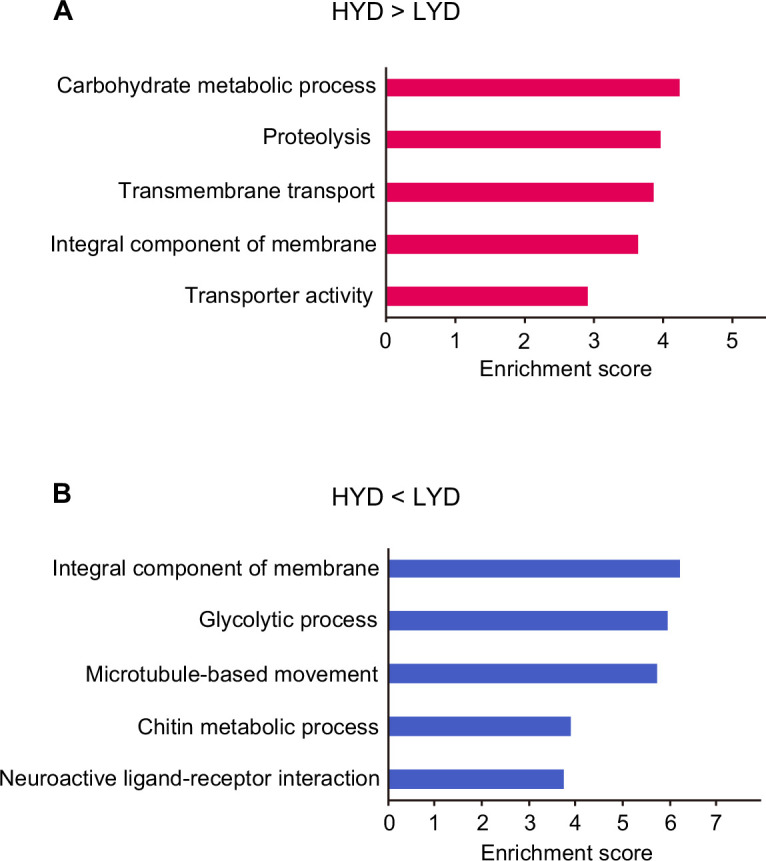
Figure 5—figure supplement 1. Enriched terms in functional annotation clustering of differentially expressed genes depending on diets in whole body RNA-seq data.


