. 2022 Dec 13;11:e81976. doi: 10.7554/eLife.81976

Figure 4. Injection with diluted RabV do not reveal any segregation between flexor and extensor premotor interneurons.

(A and B) show the distribution of LG and TA premotor interneurons on the transverse plane for individual experiments, represented with different colour shades. For each section the data are scaled to the reference points indicated in the methods in order to account for size differences along the segments. (C) LG and TA distributions overlap and the premotor interneuron distributions are highly correlated across experiments and absolute value of Hedges’ G coefficients are small (D). (E) Box and whisker plot of the mediolateral position of dorsal ipsilateral premotor interneurons in each experiment. (F) Values of the dorsal ipsilateral median for each LG and TA experiment.

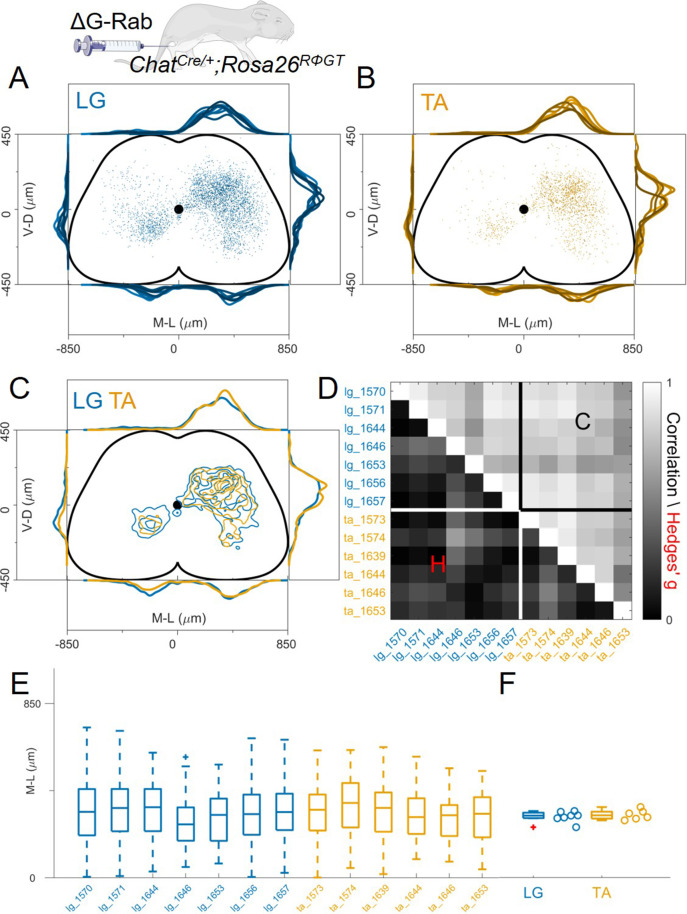
Figure 4—source data 1. Hedges’G and correlation across experiments in the lower and upper triangular matrix respectively shown in panel D.
Figure 4—source data 2. Median of mediolateral coordinates in the ipsilateral dorsal quadrant for each experiment shown in panel F, LG (n=7 experiments) and TA (n=6 experiments).

Figure 4.

Figure 4—figure supplement 1. distribution of flexor and extensor premotor interneurons pooled across all LG and TA for low titre injections shown in the transverse plane (left) and as front (middle) and lateral (right) view along the rostrocaudal axis.

Figure 4—figure supplement 1.

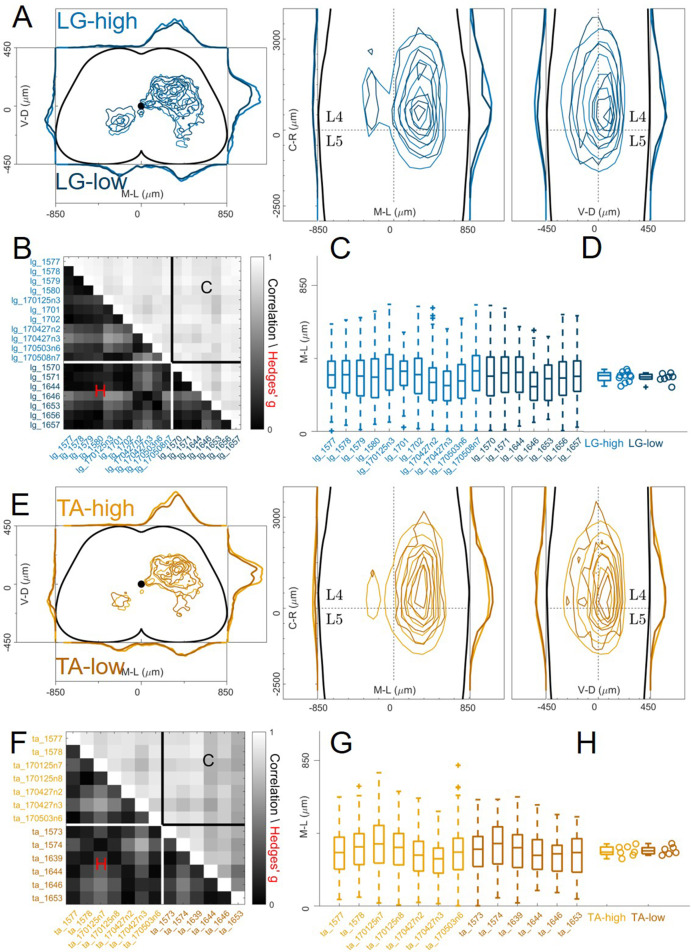
Figure 4—figure supplement 2. High and low efficiency infections give rise to the same premotor interneurons distributions.

Figure 4—figure supplement 2.

Comparison of high and low titre injections are shown in A and E for LG and TA, respectively. For each section the data are scaled to the reference points indicated in the methods in order to account for size differences along the segments. Correlations between high and low titre experiments are high and effect sizes are low for both LG and TA muscles (B and F) The distributions are similar across experiments for both muscles (B and E) and the median values of the distributions in the ipsilateral dorsal quadrant are not different for high and low efficiency of infection (C and F).
Figure 4—figure supplement 2—source data 1. Hedges’G and correlation across experiments in the lower and upper triangular matrix respectively for LG high and low titre injections shown in panel B.
Figure 4—figure supplement 2—source data 2. Median of mediolateral coordinates in the ipsilateral dorsal quadrant for each experiment shown in panel D, high titre LG (n=11 experiments) and low titre LG (n=7 experiments).
Figure 4—figure supplement 2—source data 3. Hedges’G and correlation across experiments in the lower and upper triangular matrix respectively for TA high and low titre injections shown in panel F.
Figure 4—figure supplement 2—source data 4. Median of mediolateral coordinates in the ipsilateral dorsal quadrant for each experiment shown in panel H, high titre TA (n=7 experiments) and low titre TA (n=6 experiments).
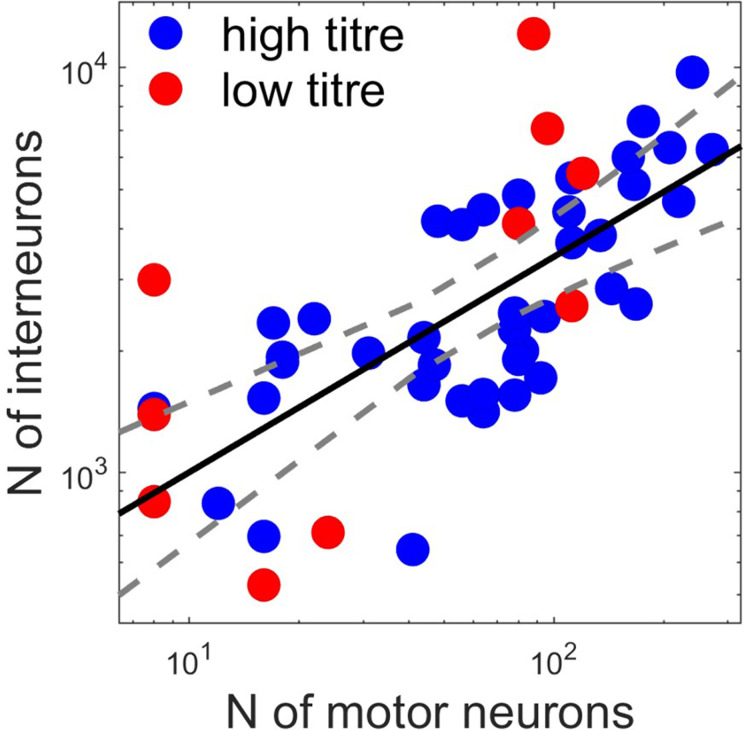
Figure 4—figure supplement 3. the relation between the number of primary infected motor neurons and premotor interneurons follow a power law y=axb with a=295 (155, 561 confidence intervals) and b=0.53 (0.37, 0.69 confidence intervals), R2=0.48.

Figure 4—figure supplement 3.

Motor neuron and interneuron numbers in each experiment are shown for high (red) and low (black) titre experiments. The fitted line represents a power law.
Figure 4—figure supplement 3—source data 1. Number of labelled motor neurons and interneurons taken from Table 1 and scaled according to the sampling intervals of the sections.