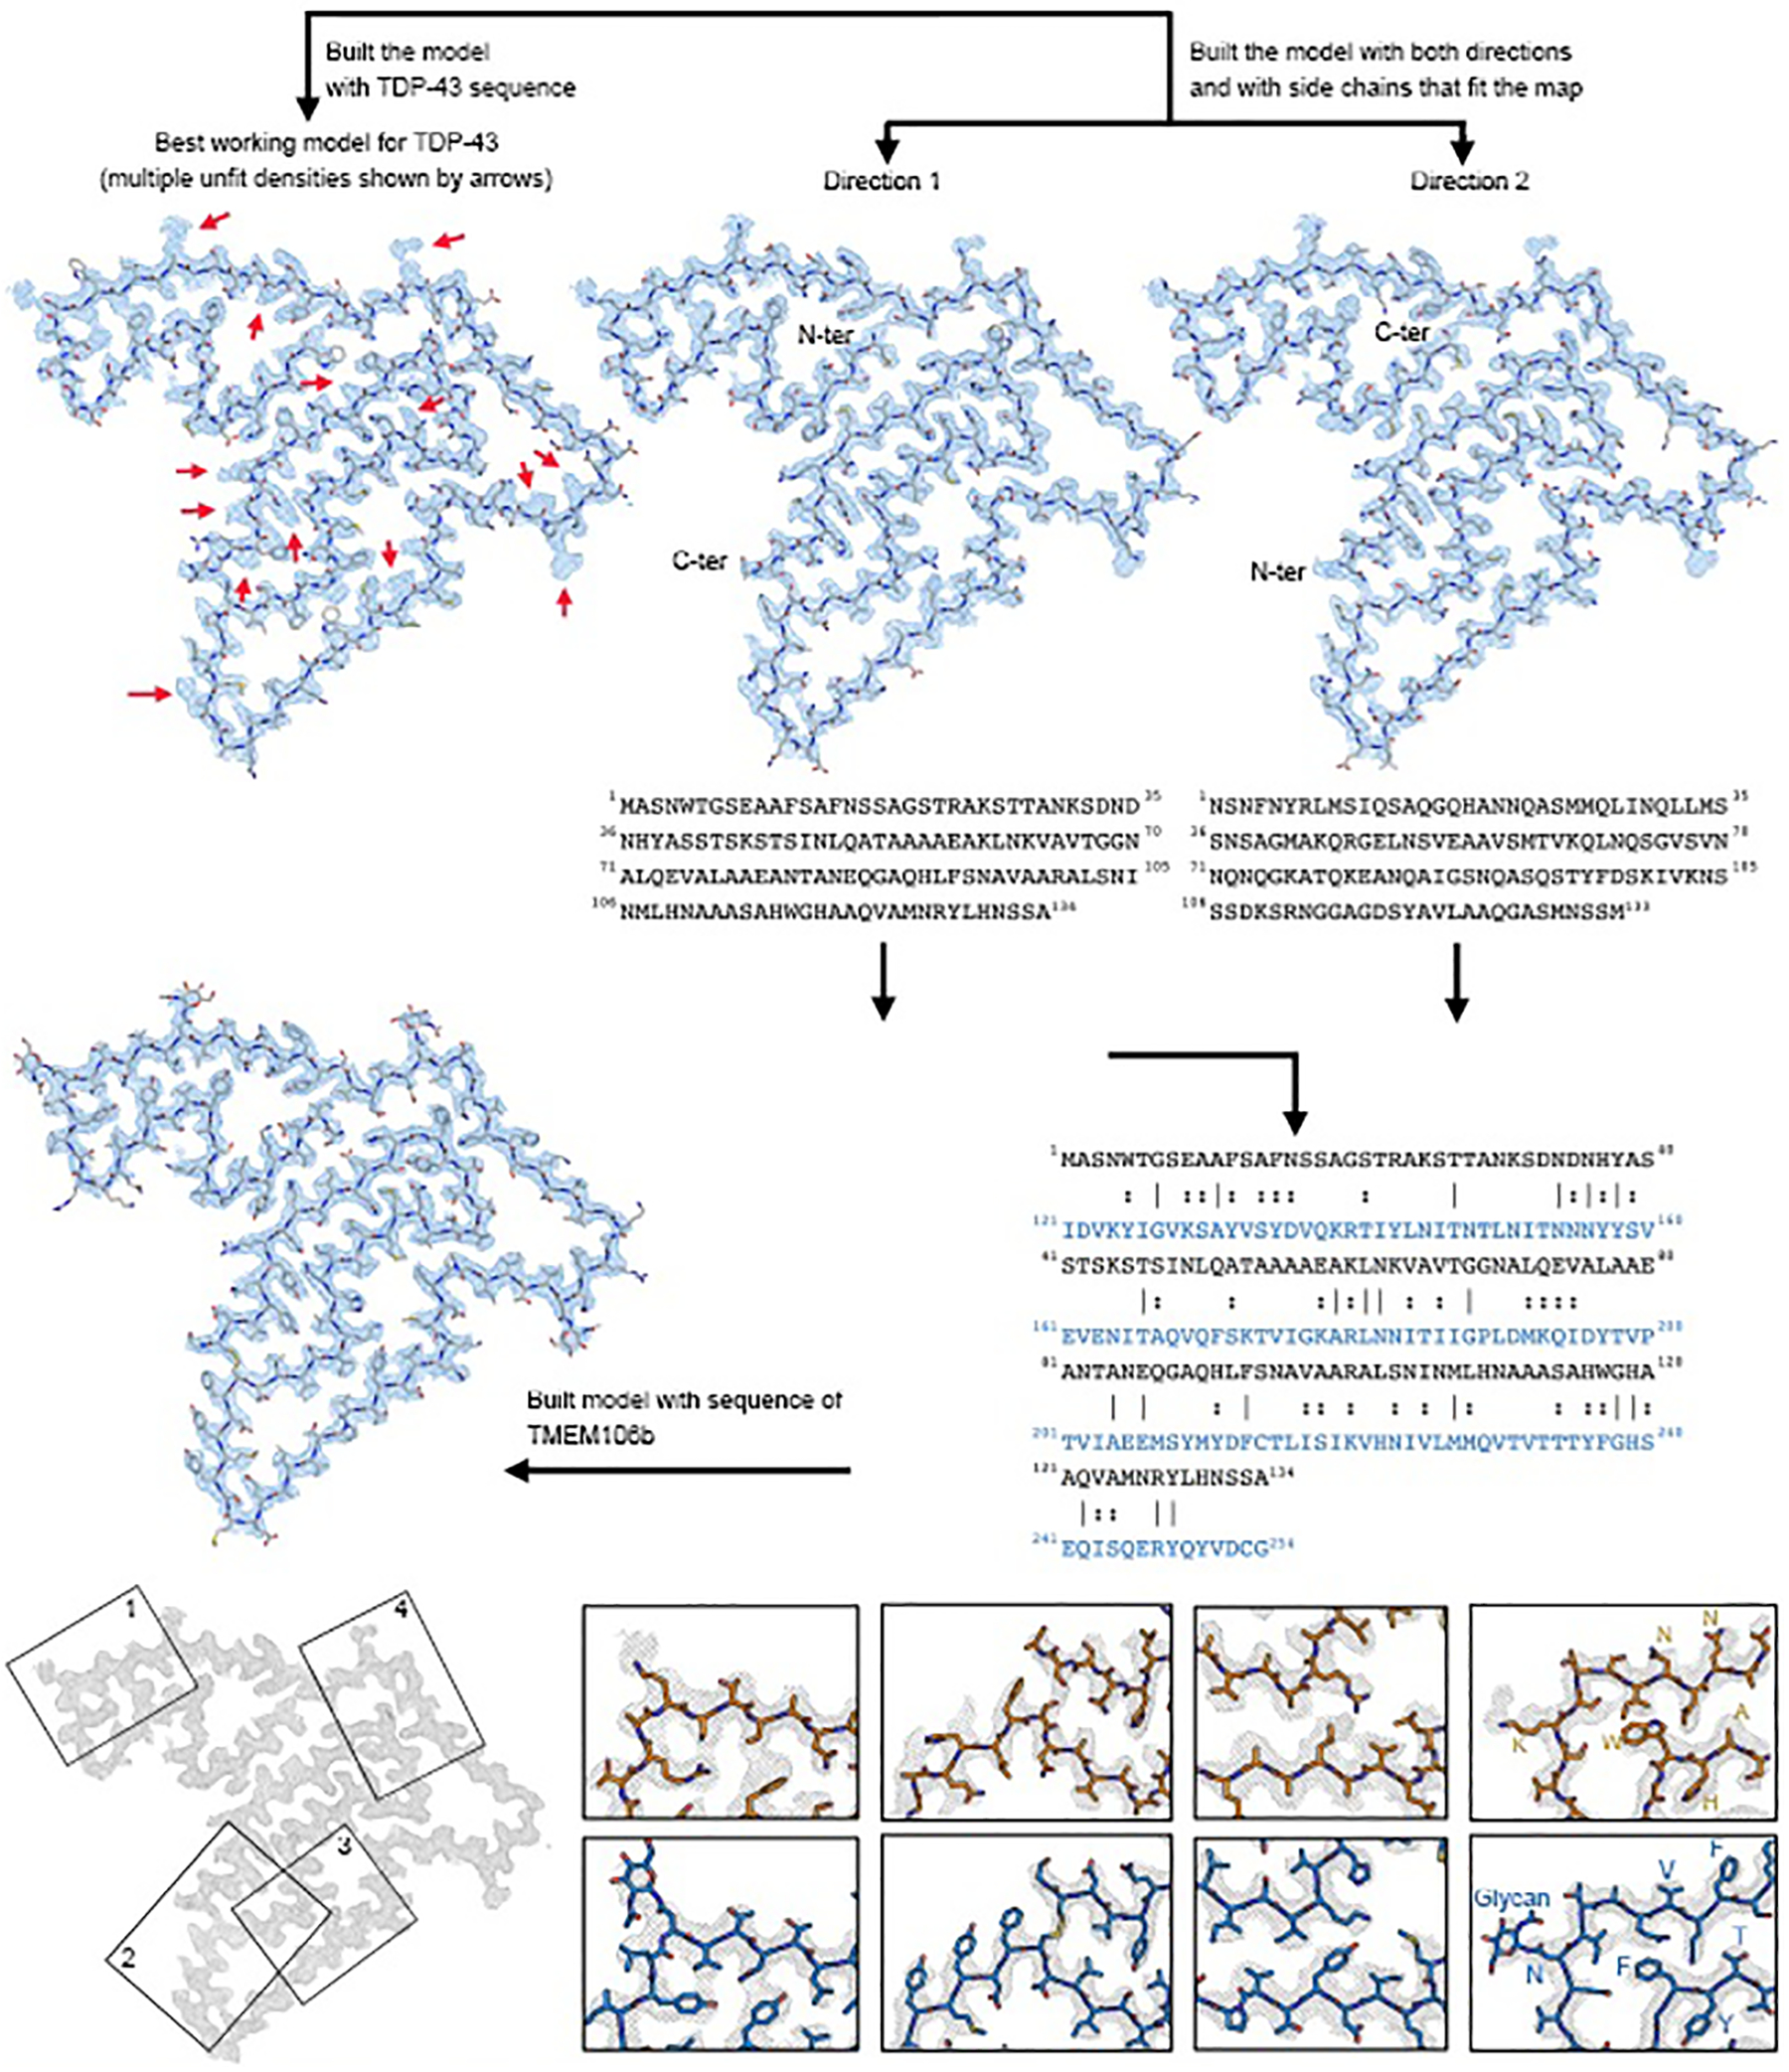
Extended Data Fig. 7. Atomic model building.

a, Model building flowchart for PM1 of FTLD-TDP donor 1. In the sequence alignment (bottom right), lines indicate identical residues and two dots indicate similar residues. b, Comparison of query model (Direction 1 chain, orange) with final model built with TMEM106B sequence (blue). Four representative regions of the cryo-EM map are shown. Residues that show clear differences in side chain density fitting are labeled in both models.
