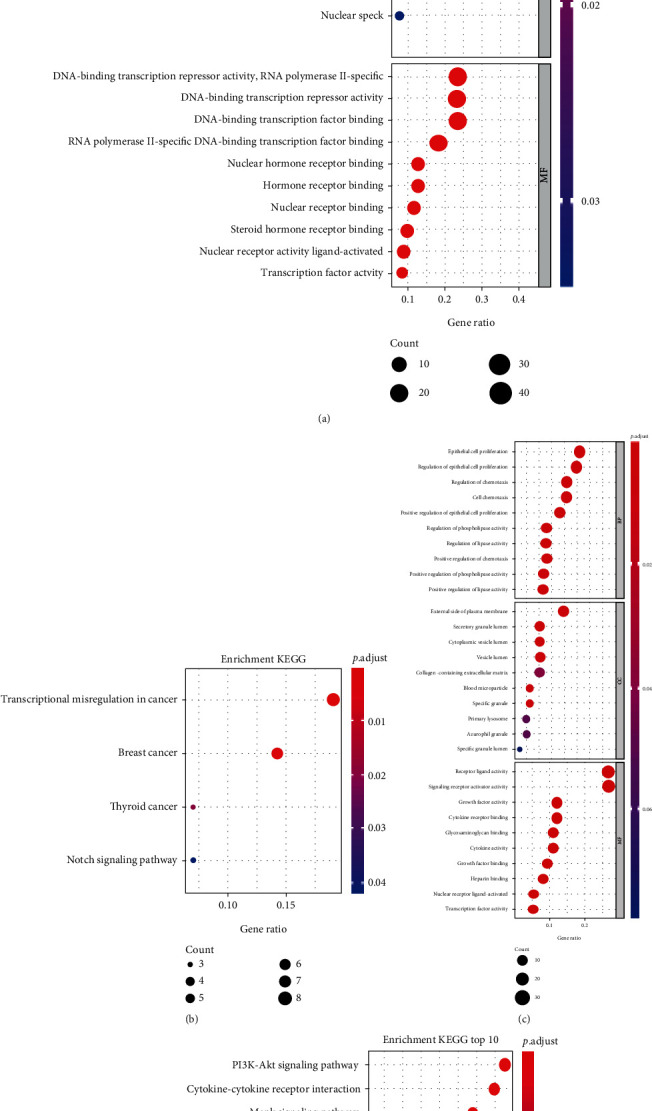
Figure 11.

GO and KEGG pathway analyses of 94 DETFs and 111 DEIRGs in endometriosis. (a) The GO analysis of DETFs. (b) The KEGG analysis of DETFs. (c) The GO analysis of DEIRGs. (d) The KEGG analysis of DEIRGs. The GO analysis included the biological processes, cellular components, and molecular functions (P < 0.05).
