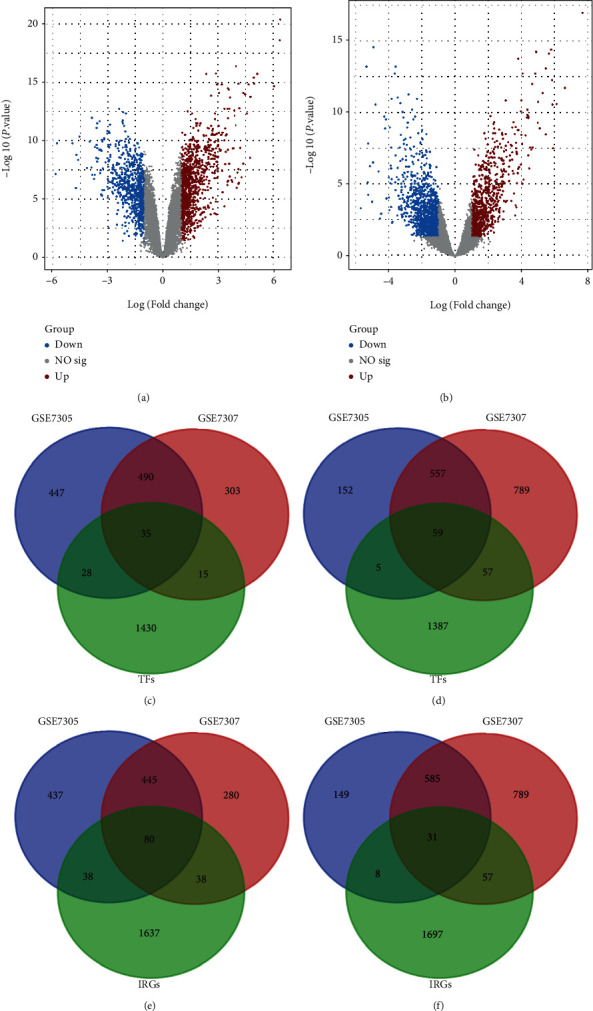
Figure 2.

Identification of 94 DETFs and 111 DEIRGs in endometriosis. (a, b) Volcano plot of DEGs in GSE7305 and GSE7307. Red and blue data points represent upregulation and downregulation, respectively. (c, d) Identification of 35 upregulated and 59 downregulated DETFs from GSE7305, GSE7307 and TFs. (e, f) Identification of 80 upregulated and 31 downregulated DEIRGs from GSE7305, GSE7307, and IRGs.
