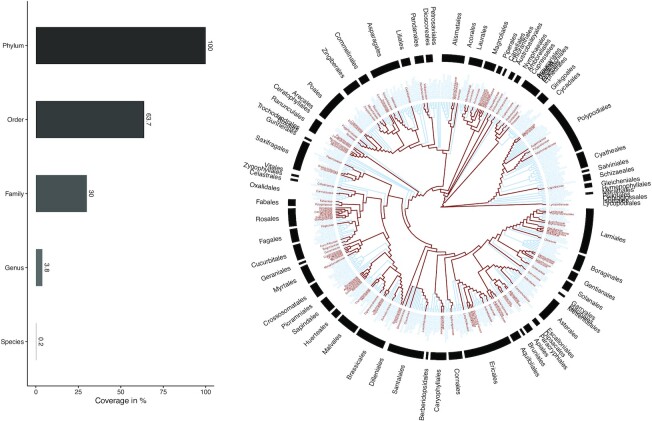
Figure 1:
Taxonomical coverage of the profiled collection (1,600). On the left, the barplot represents the overall coverage at main taxa level and up to the phylum Streptophyta. On the right, the taxonomical coverage is represented using a taxonomical tree of all families within the Streptophyta phylum. The families present within the current collection are highlighted in red. The Open Tree of Life (ott3.3) was used for taxonomy resolving. Download pdf version here.

