
Fig. 1.
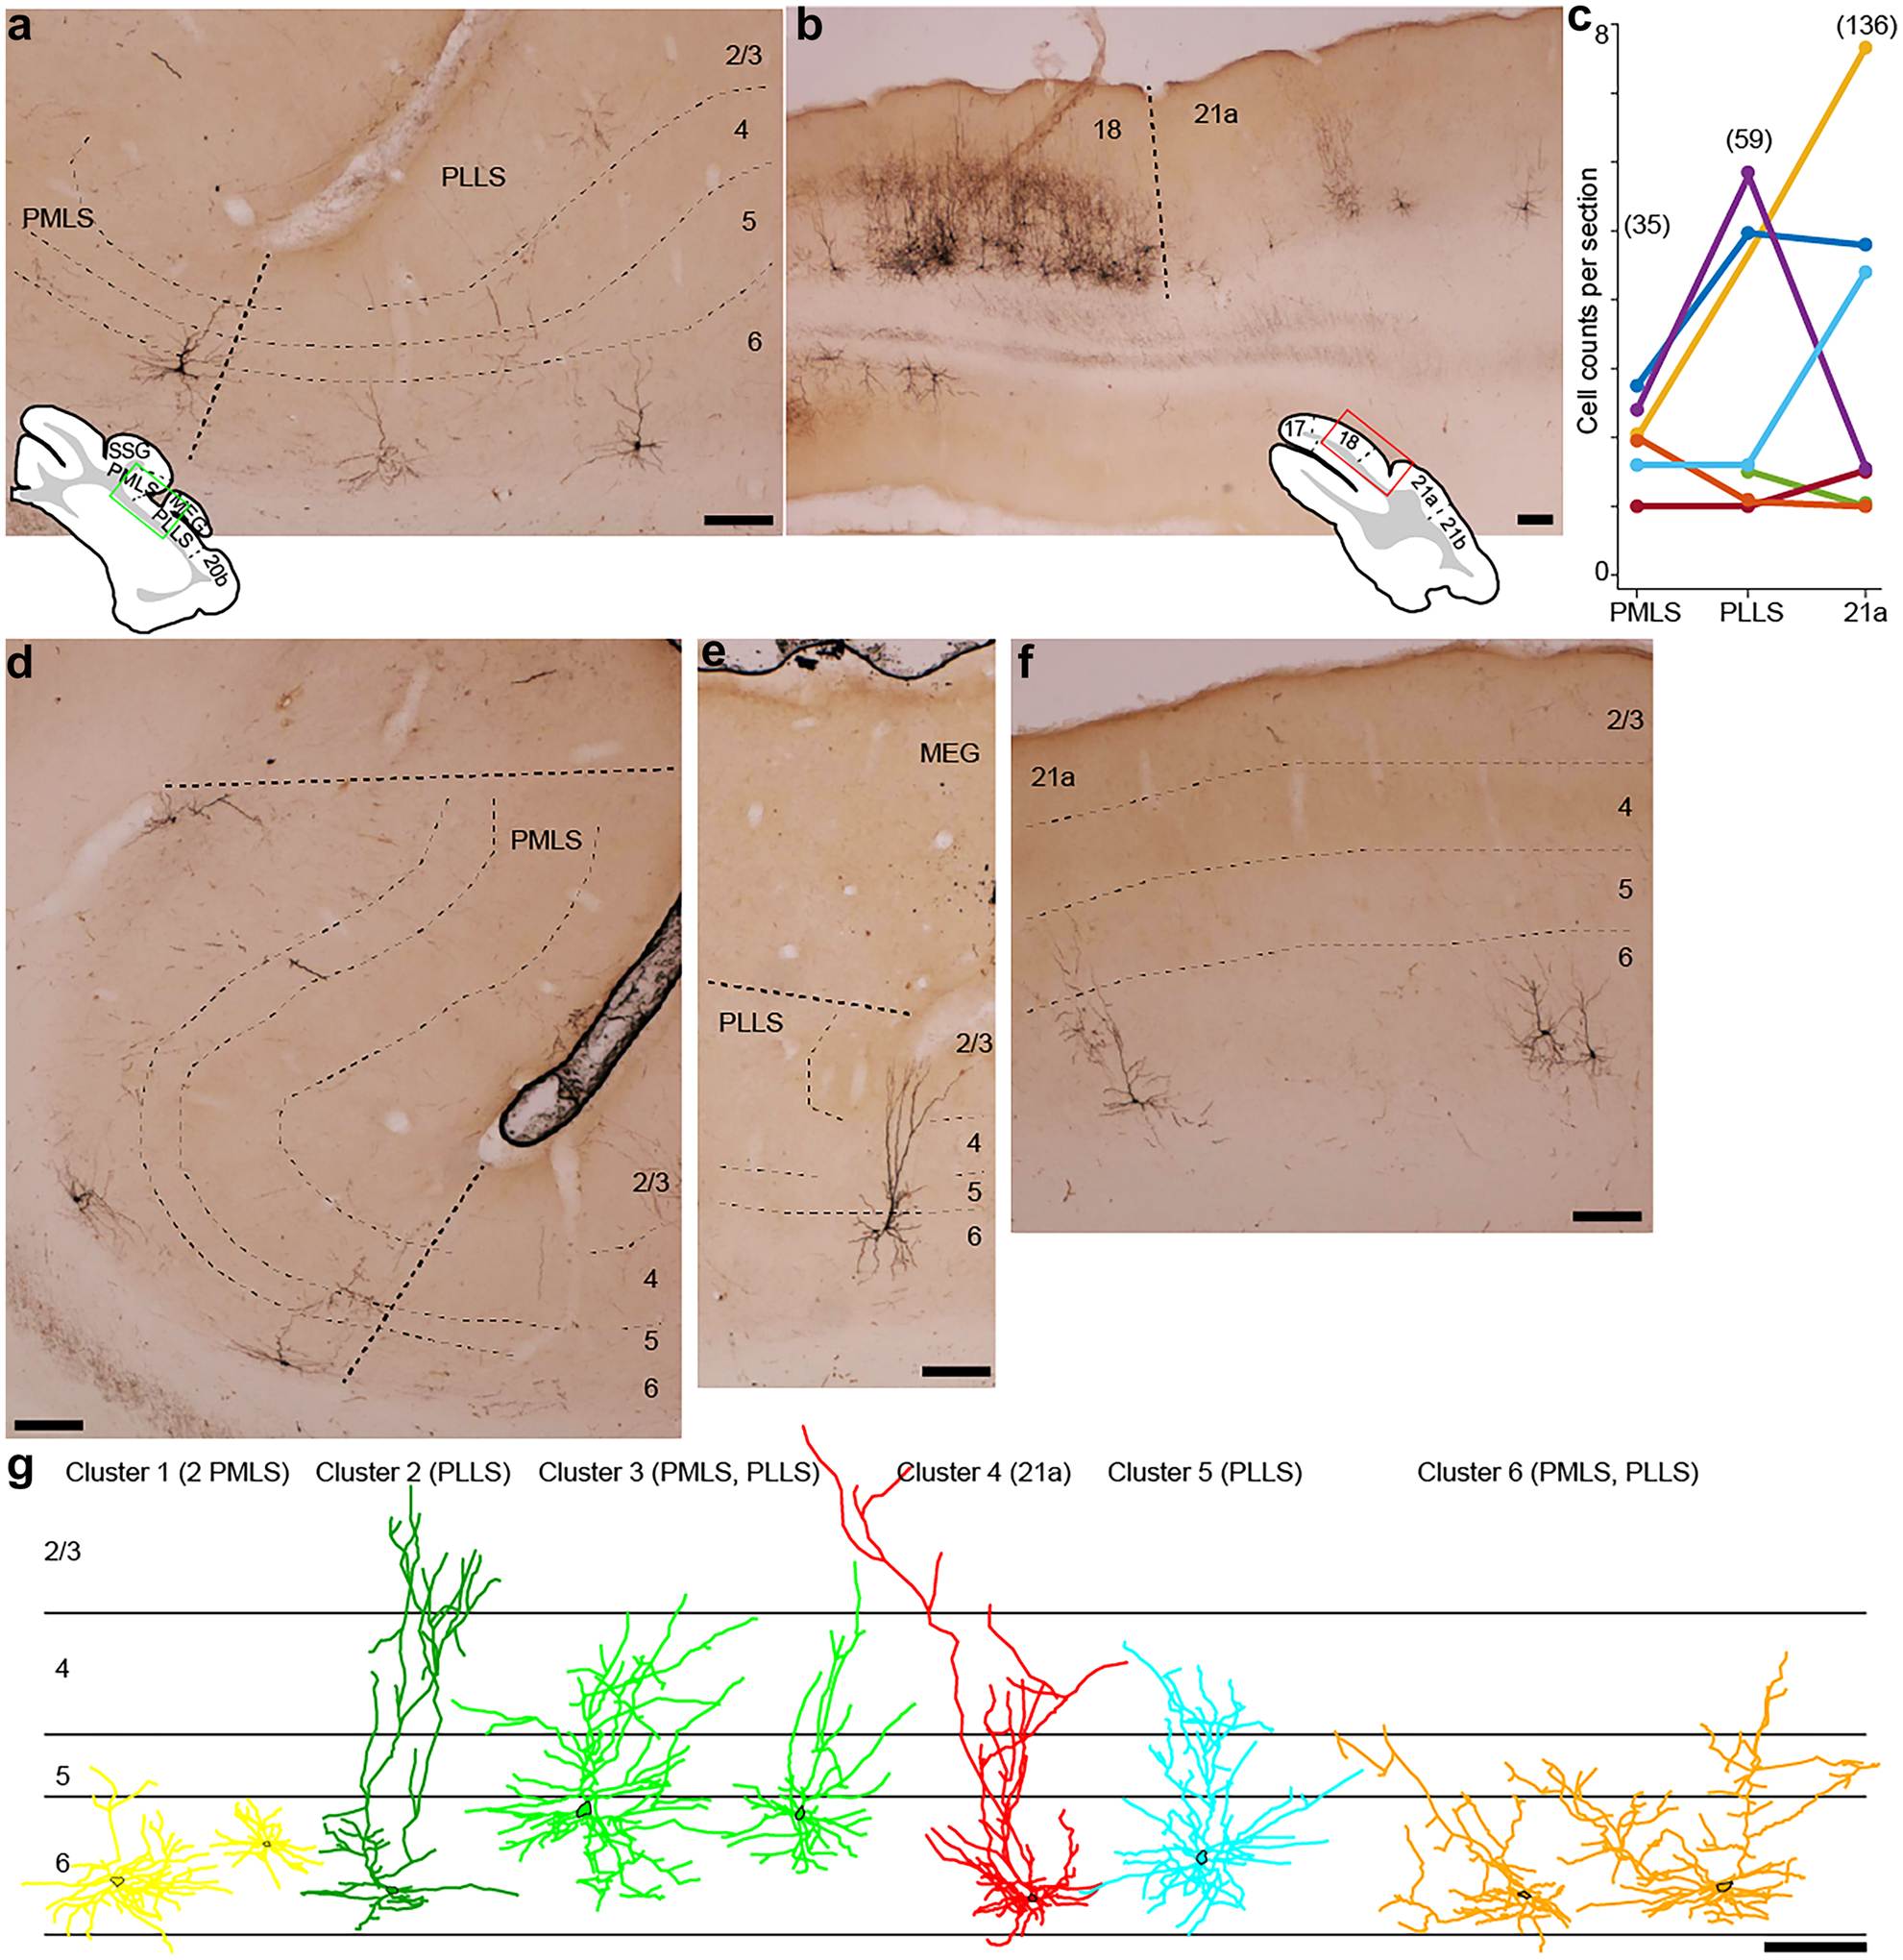
Virus-labeled corticogeniculate neurons in extrastriate areas PMLS, PLLS, and 21a. a Coronal section showing PMLS and PLLS. Green box in inset illustrates region of image. Layers are indicated by thin dashed lines and labeled at right; thicker dashed line indicates border between areas. Scale bars represent 200 μm for all panels. b Lower magnification coronal section showing areas 18 and 21a. Red box in inset illustrates region of image; dashed line indicates area border. c Counts of virus-labeled corticogeniculate neurons per area, normalized by number of sections per area. Colors represent individual ferrets. Numbers above indicate total corticogeniculate cell counts per area across all ferrets. d–f Higher magnification coronal sections through PMLS (d), PLLS (e) and 21a (f) illustrating dendritic fields of virus-labeled corticogeniculate neurons. Conventions as in a. g Representative examples of reconstructed dendritic arbors of corticogeniculate neurons in each of the six clusters (color coded as in Figs. 2 and 3). Area of origin of each reconstructed neuron listed at top. Cell bodies are indicated by black outlines. Scale bar representing 200 μm is an estimate as individual reconstructions were scaled to fit approximate laminar boundaries