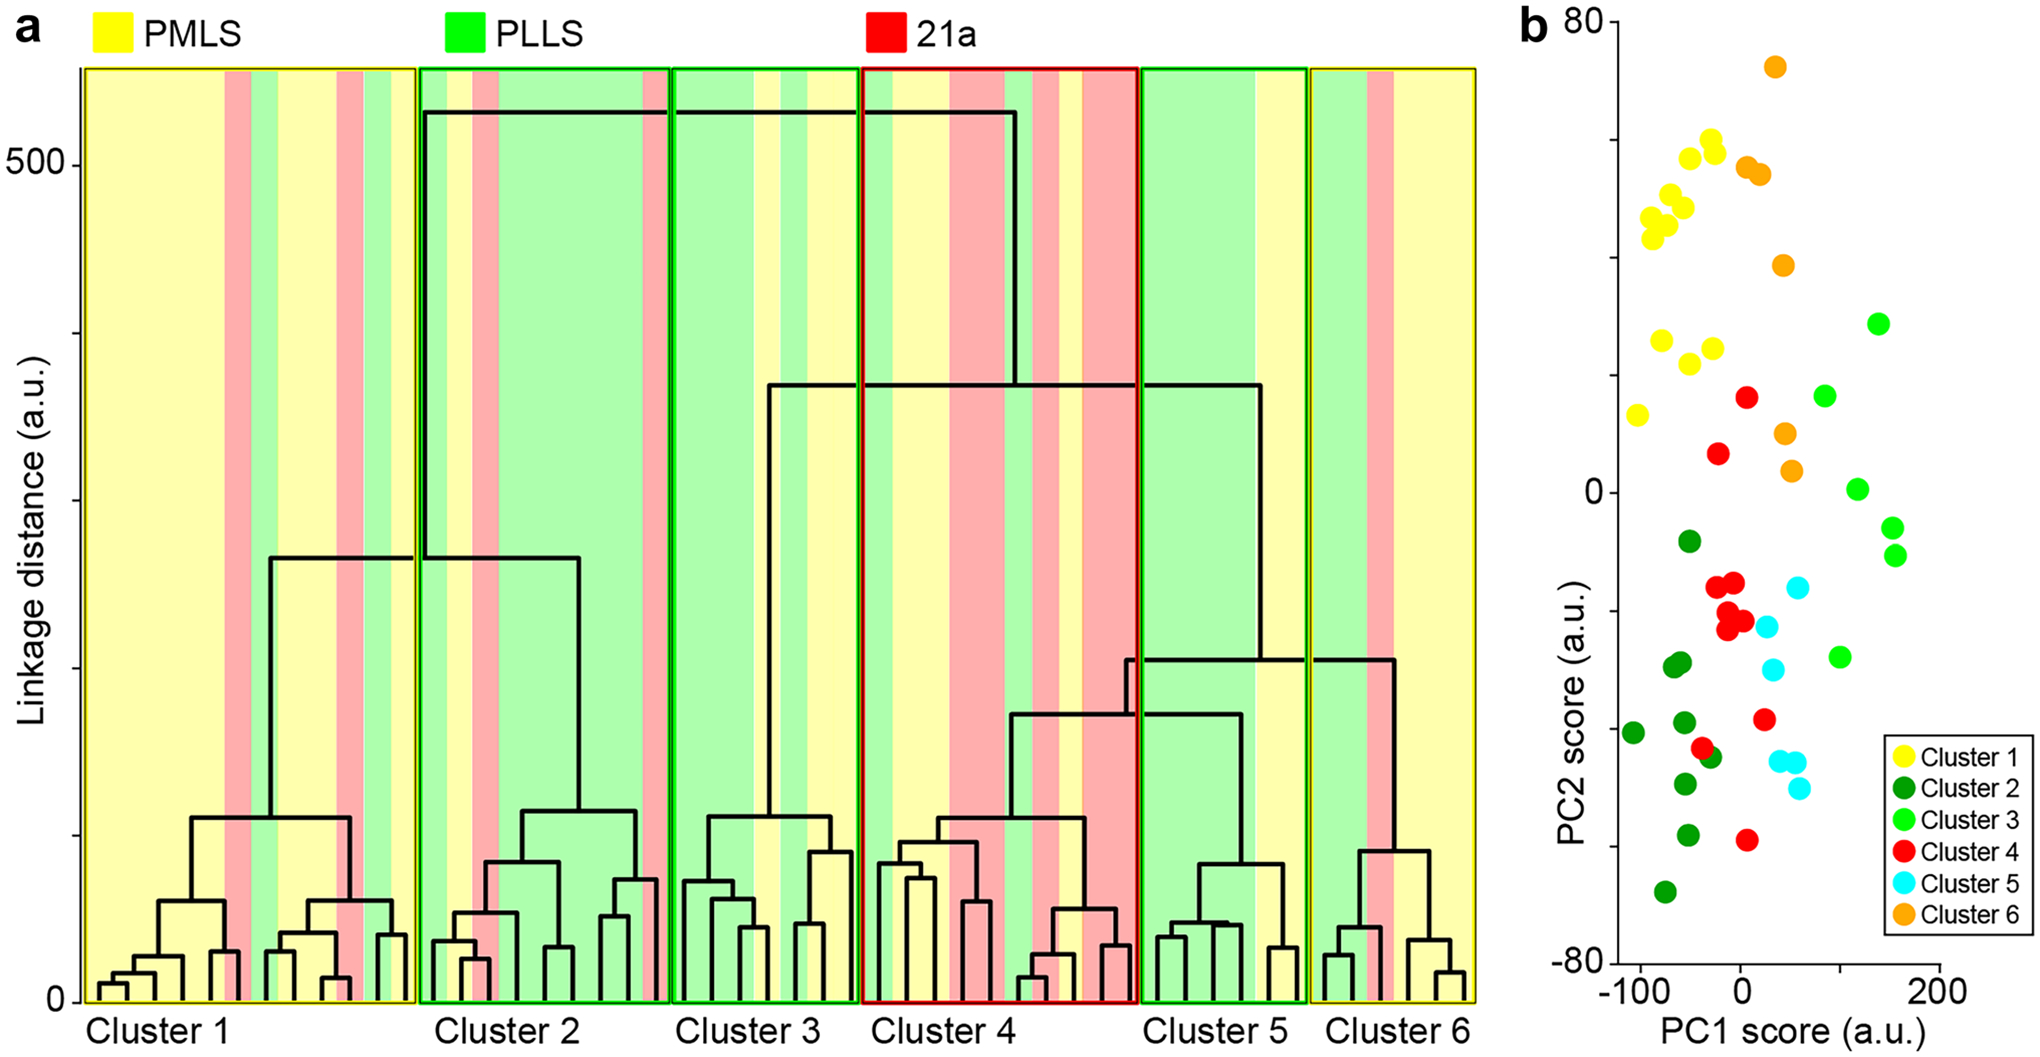
Fig. 2.

Clustering of extrastriate corticogeniculate neurons. a Dendrogram of linkage distances (arbitrary units) between individual corticogeniculate neurons based on 14 independent morphological metrics (Tables 1, 2 and 3). Colors indicate extrastriate area of origin of each corticogeniculate neuron: yellow indicates PMLS, green indicates PLLS, and red indicates 21a. Clusters indicated by thin boxes with colored outlines representing the area of origin of the majority of neurons per cluster. b Results of a separate PCA analysis of the same 14 morphological metrics used in the cluster analysis with neurons color coded by their assignment from the cluster analysis. PC1 and PC2 scores (arbitrary units) are the representations in 14-dimensional space for the first and second principal components, respectively
