
Fig. 1 |. Efficient generation of kidney organoids in 3D culture.
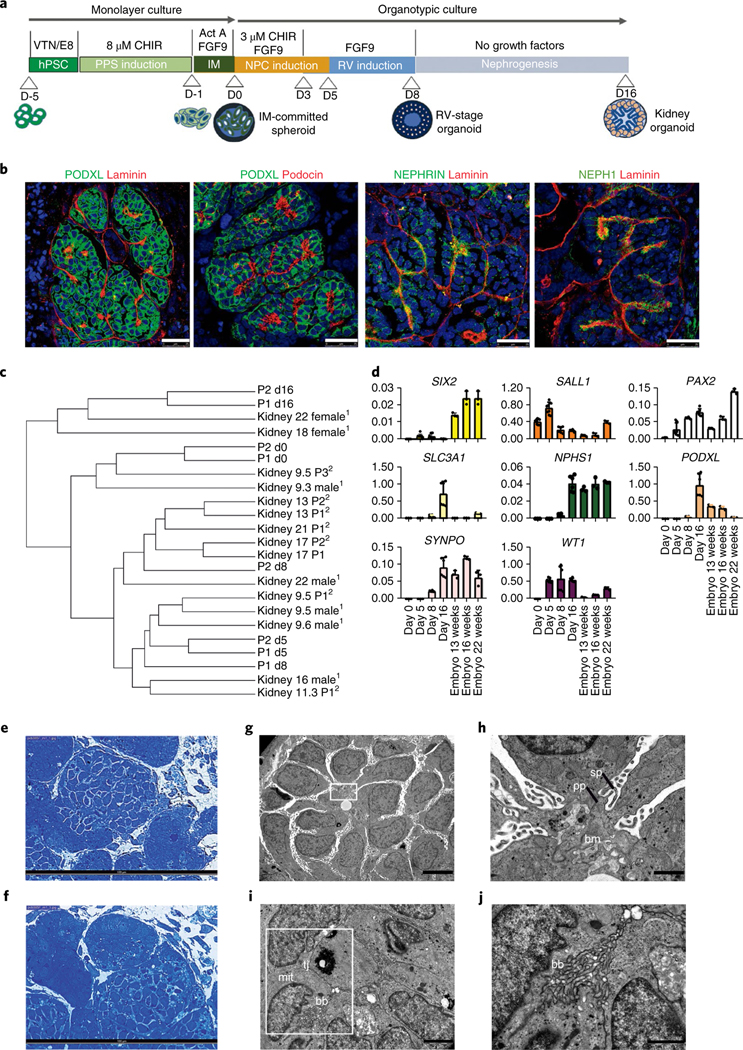
a, Schematic of the stepwise differentiation methodology for generating kidney organoids from hPSCs. b, Confocal microscopy images of glomerular structures in day 16 kidney organoids showing podocyte-like cells positive for PODXL, nephrin, NEPH1 and podocin, and the basement membrane protein laminin. Scale bars, 25 μm. c, Dendrogram representing the hierarchical clustering of day 0,5,8 and 16 kidney organoids with human fetal kidneys from 9, 13, 17 and 18 weeks of gestation (first trimester) and 22 weeks of gestation (second trimester). Data from Chuva de Sousa Lopes (SRP055513)13 (1) and McMahon (SRP111183)14 (2) are included in the analysis. d, qPCR analysis during kidney organoid differentiation and 13-, 16-, and 22-week human fetal kidneys (genes are indicated). Data are mean ± s.d. For SIX2, WT1, SALL1 and PAX2, day 0, day 5, n = 3; day 8, day 16, n = 2. For PODXL, SLC3A1, SYNPO and NPHS1, day 0, day 5, n = 1; day 8, day 16, n = 2. Each sample is a pool of six organoids. Three technical replicates are shown per sample. e,f, Semithin sections of day 16 kidney organoids showing glomerular (e) and tubular-like (f) structures. Scale bars, 100 μm. g–j, TEM of day 16 kidney organoids. g, Immature podocytes. Scale bar, 5 μm. h, A magnified view of the boxed region in g showing a detail of podocyte-related structures including the deposition of a basement membrane (bm), and primary (pp) and secondary cell processes (sp). Scale bar, 1 μm. i, Epithelial tubular-like cells with brush borders (bb), high mitochondrial (mit) content and tight junctions (tj). Scale bar, 2 μm. j, A magnified view of the boxed region in i showing a detail of brush borders. Scale bar, 1 μm.