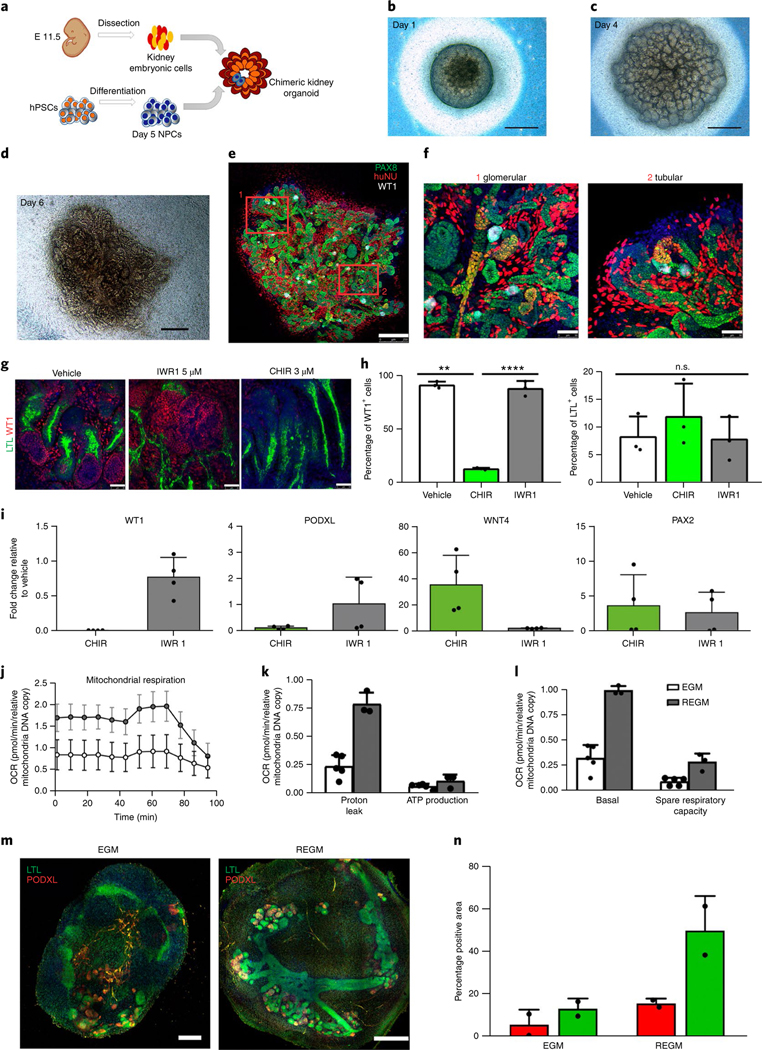
Fig. 2 |. Kidney organoids model human kidney organogenesis in vitro.

a, Representation of the coculture of day 5 NPCs with mouse embryonic kidney cells. b–d, Bright-field images of reaggregates after 1 d (b), 4 d (c) and 6 d (d) in culture. Scale bars, 500 μm. e, Immunocytochemistry for PAX8, WT1 and HuNu of the reaggregate in d. Scale bar, 250 μm. f, Magnified views of d. Scale bars, 50 μm. g–i, Modulation of β-catenin signalling in kidney organoids with IWR1 and CHIR inhibitors. g, Immunocytochemistry for WT1 and LTL in day 16 kidney organoids with the indicated regimens. Scale bars, 50 μm. h, Corresponding quantification of the percentage of WT1+ cells and LTL+ structures. Data are mean ± s.d. n = 3 organoids per treatment. One-way analysis of variance with Tukeýs post hoc test. For % WT1, F (1.009, 2.017) = 213.6, P = 0.0045; vehicle versus CHIR, **P = 0.0082; CHIR versus IWR1, ****P = 0.000034; vehicle versus IWR1, n.s., not significant, P = 0.9995. For % LTL, F (1.002, 2.004) = 0.9976, P = 0.4232, not significant. i, Corresponding qPCR analysis (genes are indicated). Data are mean ± s.d. (three technical replicates). j–l, Energy metabolism profile of kidney organoids maintained in EGM or REGM: kinetic oxygen consumption rate (OCR) response (j), inner mitochondrial membrane proton leak and cellular ATP production (k) and basal respiration and spare respiratory capacity (l). Data are normalized to mitochondrial DNA copy number/sample. Data are mean ± s.d. n = 3 (EGM) and n = 2 (REGM) organoids. m, Immunocytochemistry for LTL and PODXL in day 16 kidney organoids under EGM or REGM regimen. Scale bars, 200 μm (EGM) and 400 μm (REGM). n, Corresponding quantification of the percentage of PODXL+ and LTL+ structures. Data are mean ± s.d. n = 2 organoids per condition.
