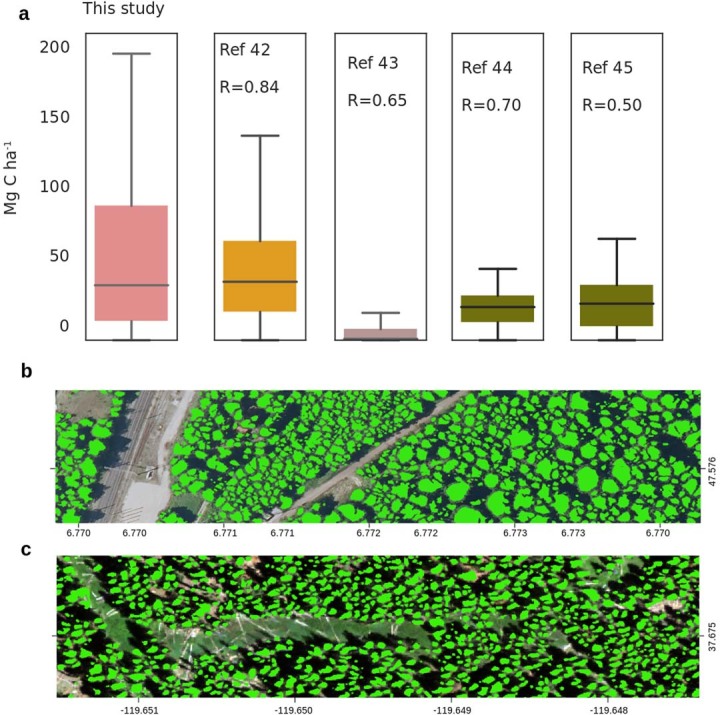
Extended Data Fig. 8. Beyond Rwanda.

a, We took 150 (n = 150) random 1 × 1 km samples and aggregated the predicted tree-level carbon stocks and compared the results to previously published maps using two-tailored Pearson correlation. We did not include ref. 61 because of the coarse native resolution which did not guarantee that the same areas were compared. Note that ref. 45 does not report values above 85 Mg biomass per hectare, explaining the lower correlation values. P < 0.001 for all correlations. b, The model trained on the Rwanda aerial images was directly applied on aerial images from France (20 cm) and c, NAIP aerial images at 60 cm. In boxplots in a, lines from top to bottom represent the maximum, third quartile, median, first quartile and minimum values. Credit: photographs in b, USGS NAIP; c, IGN France.
