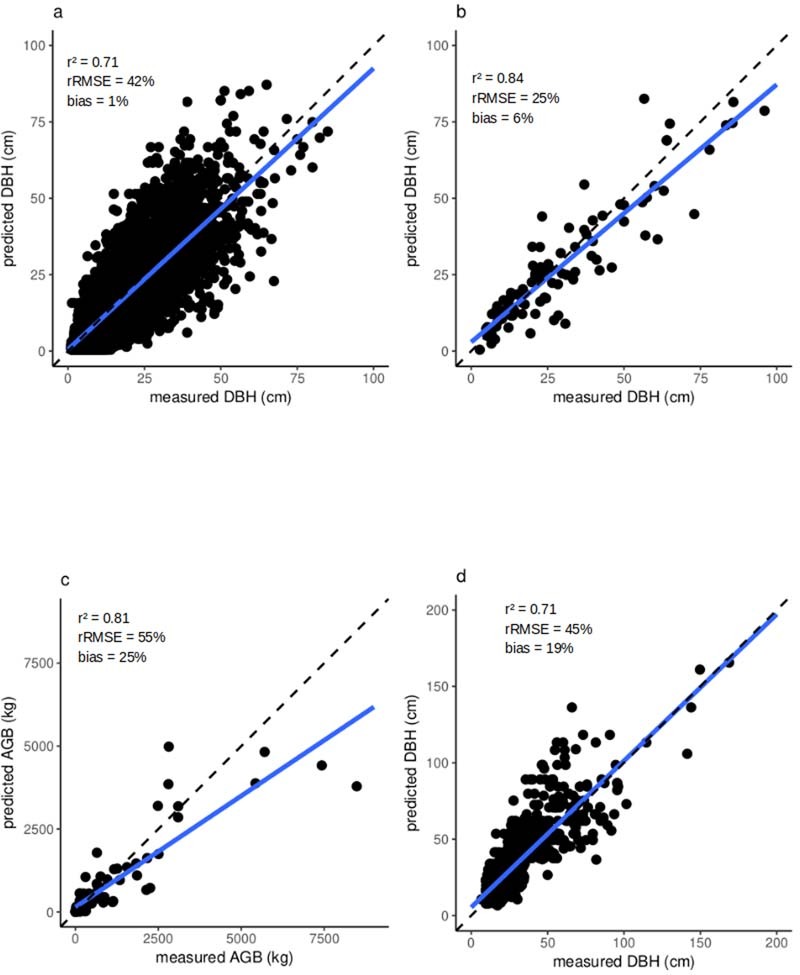
Extended Data Fig. 3. Tree crown allometry.

a, DBH is predicted from CD using a total of 11,593 samples from a global database36. The plot compares the predicted against the measured DBH. b, DBH is predicted for an independent dataset of 93 trees from Kenya using the equation derived from (a). c, We used an allometric equation from literature37 to calculate AGB from the CD predicted DBH shown in (b). Predicted AGB is here compared with destructively measured AGB. d, While samples shown in a–c are all outside forests, (d) shows 793 field-measured trees from Rwanda’s natural forest. As in (a), DBH was predicted from CD. The bias was calculated following equation (1).
