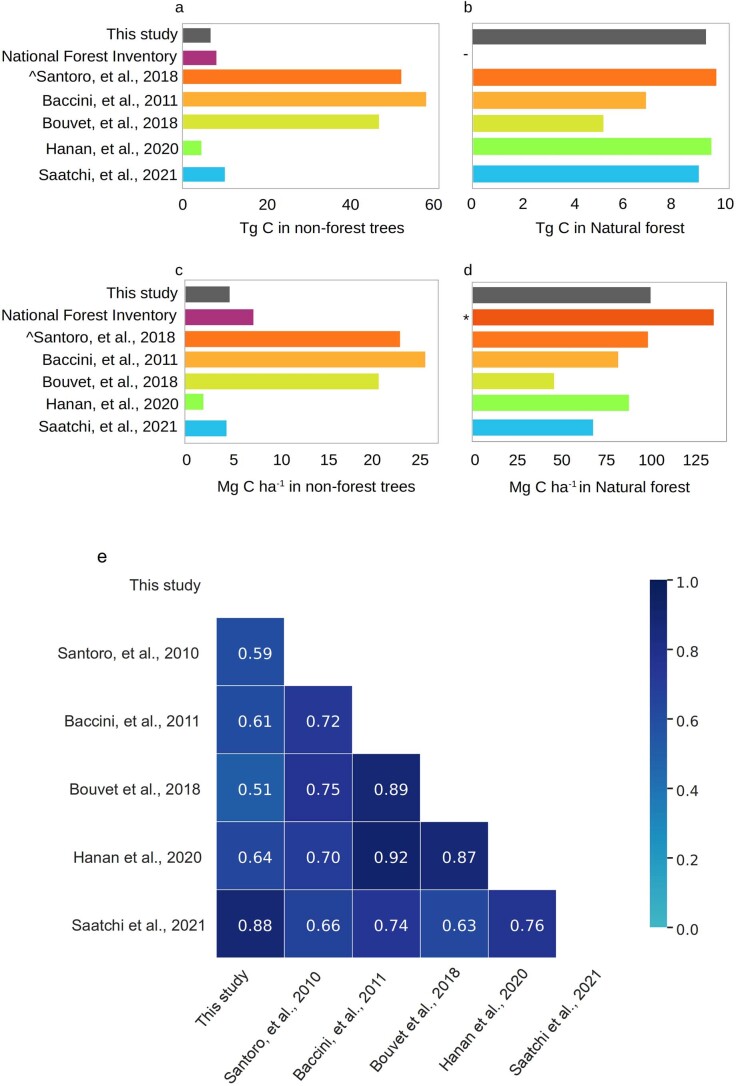
Extended Data Fig. 4. Comparison of aboveground carbon estimations at country scale.
a, Comparison of predicted total aboveground carbon stocks by this study, NFI and existing global products for non-forest areas. b, Same as (a) but for natural forests. c, Comparison of predicted aboveground carbon density by this study, NFI, and existing global products for non-forest areas. d, Same as (c) but for natural forests. e, Correlation matrix showing the two-tailored Pearson correlation for 1×1 km2 grids between different biomass datasets. Note that ref. 45 does not report values above 85 Mg biomass per hectare (Supplementary Fig. 2), explaining the lower correlation values. P < 0.001 for all correlations. (^ We selected the 2010 version; - Natural forest is not considered as part of the NFI; * ref. 40 and ref. 41).

