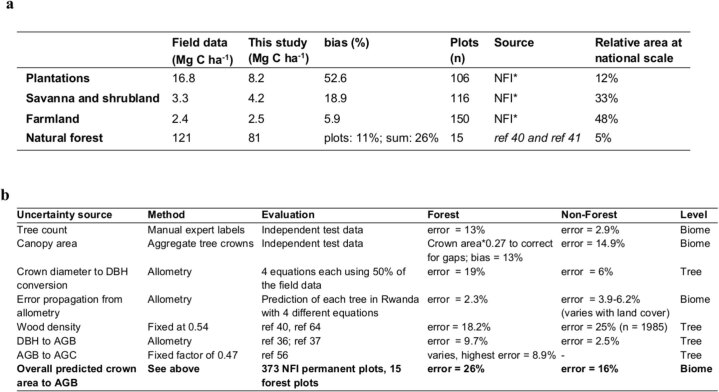
Extended Data Table 1.
Evaluation with field data
a, We compared our tree-level carbon stock estimates aggregated to 1 ha grids with field data from different sources. The exact location of the NFI plots was unknown, so we used averages of the areas close by. The statistics were then calculated for averages per class, except for natural forests where exact plot coordinates were available, therefore, comparisons could be done per plot. We then weighted the bias according to the relative area at the national scale to derive a nation-wide uncertainty of 16.9% (NFI total C in TOF: 8.35 TgC; this study estimates 6.95 TgC). *The NFI original measurements are the aboveground biomass expressed in volume (m3). We have converted them in weight (metric tonnes) using the conversion rate: 1 m3 = 0.714 tonne (ref. 65) which assumes an overall average wood density of 0.714 g/cm3 per tree, then multiplied by the AGB-to-AGC conversion factor: 0.47 to get the C equivalent. b, Different sources of uncertainty and how we evaluated and quantified their impact. Errors at the biome level may be systematic. Errors at tree level were evaluated with equation (1), and errors at biome and plot level with equation (2)

