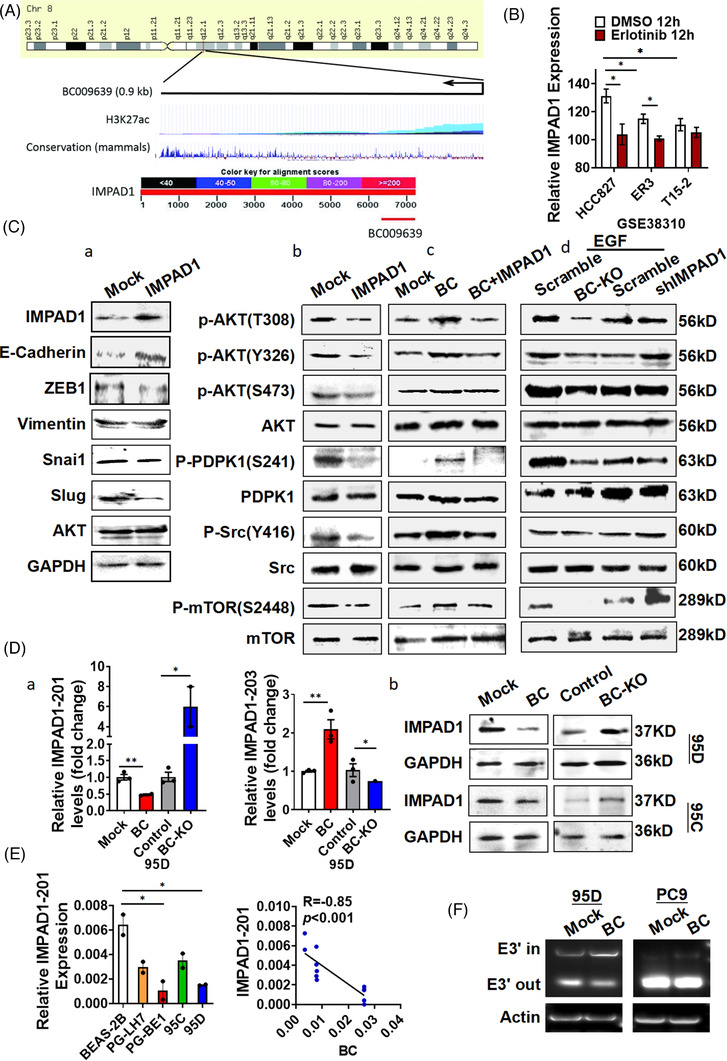
FIGURE 3.

BC enhanced the epithelial–mesenchymal transition by regulating inositol monophosphatase domain containing 1 (IMPAD1) alternative splicing. (A) Schematic representation of BC and UCSC Genome Browser tracks depicting H3K27ac chromatin immunoprecipitation (ChIP)‐seq coverage (upper) and mammalian conservation in human cell lines (middle). Schematic diagram of the complementation between the IMAPD1 nucleotide sequence and BC determined by BLAST (lower). (B) IMPAD1 expression analysis of cells resistant or sensitive to erlotinib was performed using public microarray dataset GSE38310. (C) (a) IMPAD1, cadherin, vimentin, Snai1, ZEB‐1, Slug and AKT were detected by Western analysis in 95D and A549 cells overexpressing IMPAD1; (b) phosphorylation of AKT, PDPK1, Src and mTOR in 95D cells overexpressing IMPAD1 was measured; (c and d) phosphorylation levels of AKT, PDPK1, Src and mTOR were determined by Western blot in (c) 95D cells with BC and IMPAD1 co‐transfection and (d) 95D cells with BC knockout or IMPAD1 knock‐down after 10 ng/ml EGF treatment. (D) (a) The IMPAD1‐201 and IMPAD1‐203 splice variants were detected by RT‐qPCR in 95D cells after BC overexpression or knock‐down; (b) IMPAD1 expression was detected by Western analysis in 95D and 95C cells with BC overexpression or knockout. (E) IMPAD1‐201 expression was measured by RT‐qPCR in BEAS‐2B, PG‐LH7, PG‐BE1, 95C and 95D cells (left). Pearson correlation between BC and IMPAD1‐201 expression levels is shown (right). (F) The splicing of IMPAD1‐203 exon 3′ in 95D and PC9 cells was detected by PCR. Data are represented as mean ± SEM of at least three independent experiments. *p < .05, **p < .01
