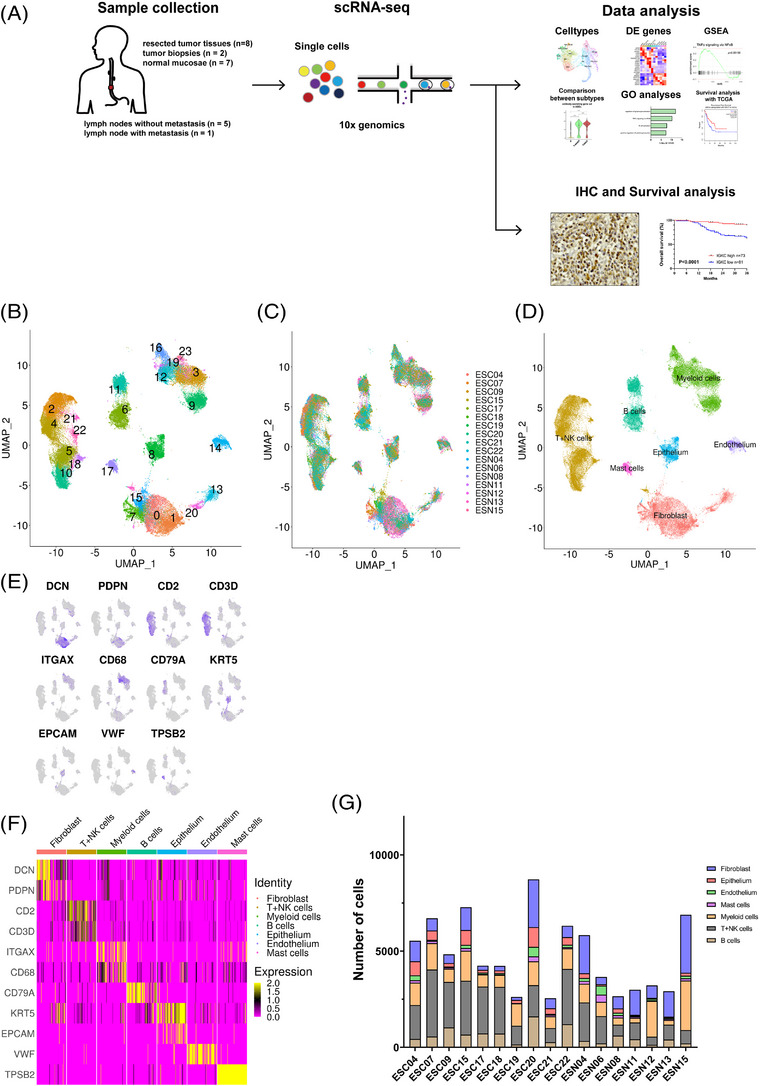
FIGURE 1.

Schematics of scRNA‐seq and major cell types in ESCC. (A) Schematic illustration of the experimental workflow in our study. (B) UMAP plot showed 24 clusters from eight resected tumour tissues, two tumour biopsies and seven normal tissues. (C) The UMAP plots were coloured by sample origin. (D) UMAP plot showed seven major cell types using canonical marker genes. (E) UMAP plots showed the expression levels of canonical marker genes. (F) Heatmap of the canonical marker genes in each major cell type. (G) The number of the major cell types in the sample origins.
