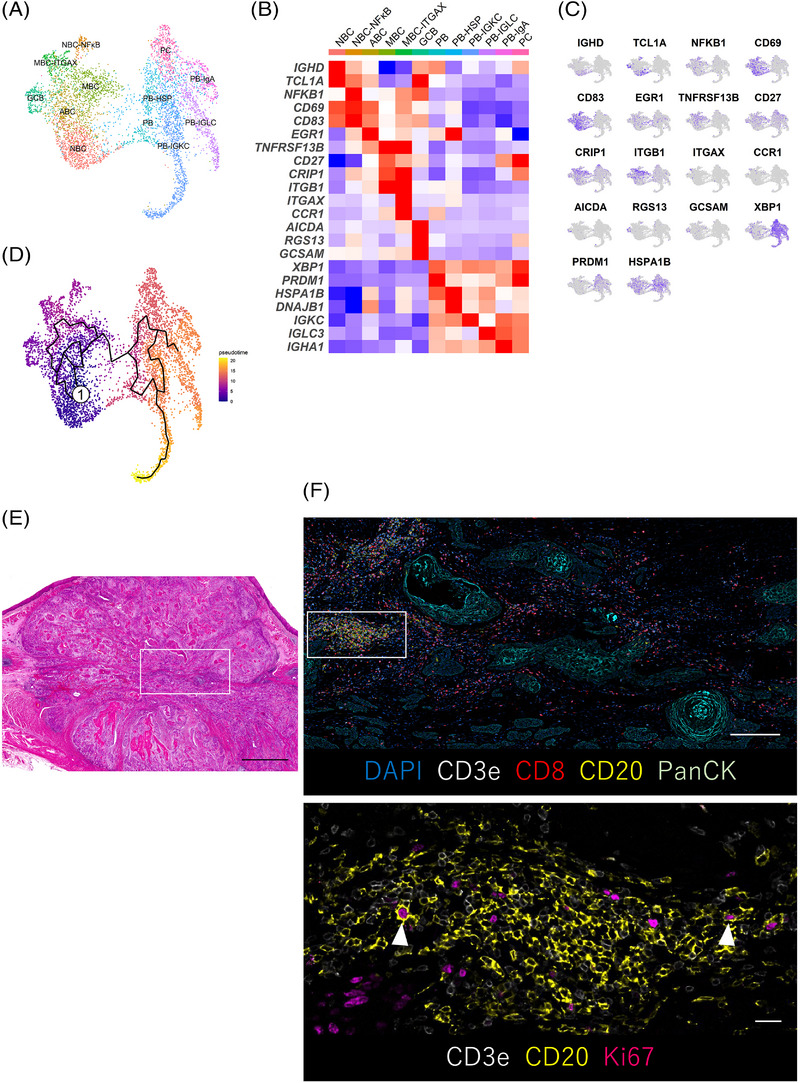
FIGURE 2.

The subtypes of TIL‐Bs in ESCC. (A) UMAP plot was color‐coded by 12 subtypes of TIL‐Bs on the basis of representative genes. (B) Heatmap indicated representative genes of B cells in each subtype. (C) UMAP plots showed the expression levels of representative genes in TIL‐Bs. (D) Trajectory analysis was performed between B cell subtypes. (E and F) CODEX multiple staining images showed intratumoural germinal centre B cells (CD20+, Ki67+; white arrowheads). Representative histologic section of ESCC (H&E, merged images using image‐joint software) (E). The CODEX multiple staining images of DAPI, CD3e, CD8, CD20 and PanCK (F, top) and high magnification images of CD3e, CD20 and Ki67 (F, bottom). Regions of interest were shown in the white box. Scale bars, 2000 μm (E), 1000 μm (F, top) and 100 μm (F, bottom).
