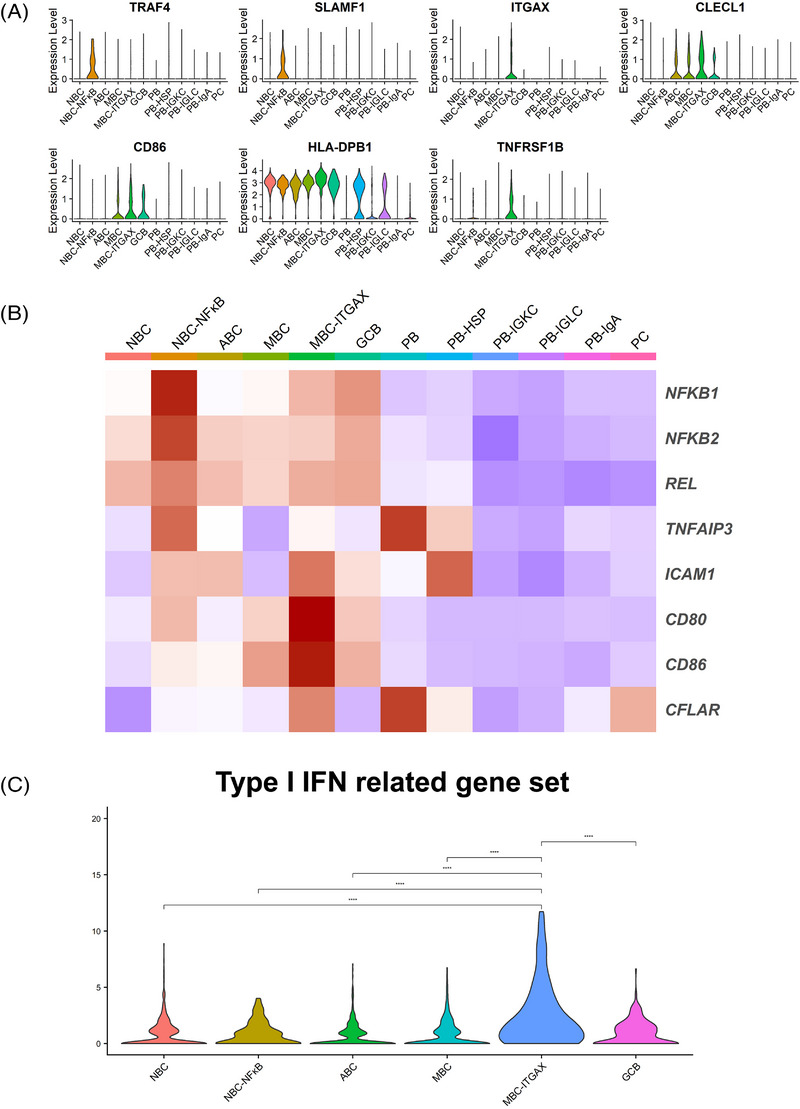
FIGURE 3.

The expression of specific functional genes in TIL‐B subtypes. (A) Violin plots showed the expression of specific functional genes in each subtype. (B) Heatmap indicated the expression of functional genes in each subtype. (C) Violin plots showed the expression of the type I IFN‐related gene set in B cells except for ASCs. Significance of expression (p value) between tissue source types was determined by Wilcoxon rank‐sum test, with all p values adjusted using Bonferroni correction. **** p < .0001
