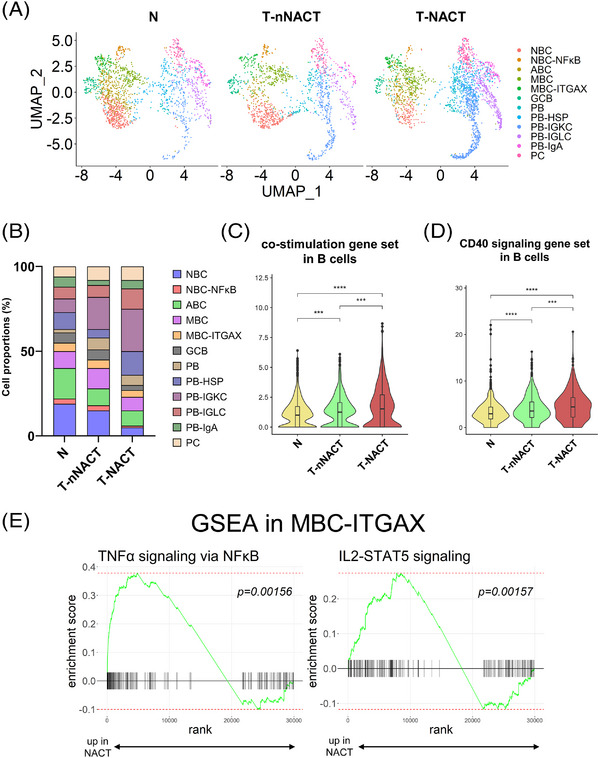
FIGURE 4.

Changes in proportions and functions of TIL‐B subtypes by the tissue source type. (A) UMAP plots showed 12 subtypes of TIL‐Bs by the tissue source type. (B) Bar plots showed the proportions of 12 subtypes of TIL‐Bs by the tissue source type. (C and D) Violin plots showed the expressions of co‐stimulation (C) and CD40 signalling‐related gene set (D) in B cells except for ASCs by the tissue source type. Significance of these gene set enrichment (p value) between tissue source types was determined by Wilcoxon rank‐sum test. Boxplots included centreline, median; box limits, upper and lower quartiles; whiskers at most 1.5× the interquartile range past upper and lower quartiles. *** p < .001, **** p < .0001. (E) GSEA results showed the TNFα signalling via NF‐κB pathway and IL2‐STAT5 signalling pathway was enriched in the MBC–ITGAX subtype from NACT patients compared with nNACT patients.
