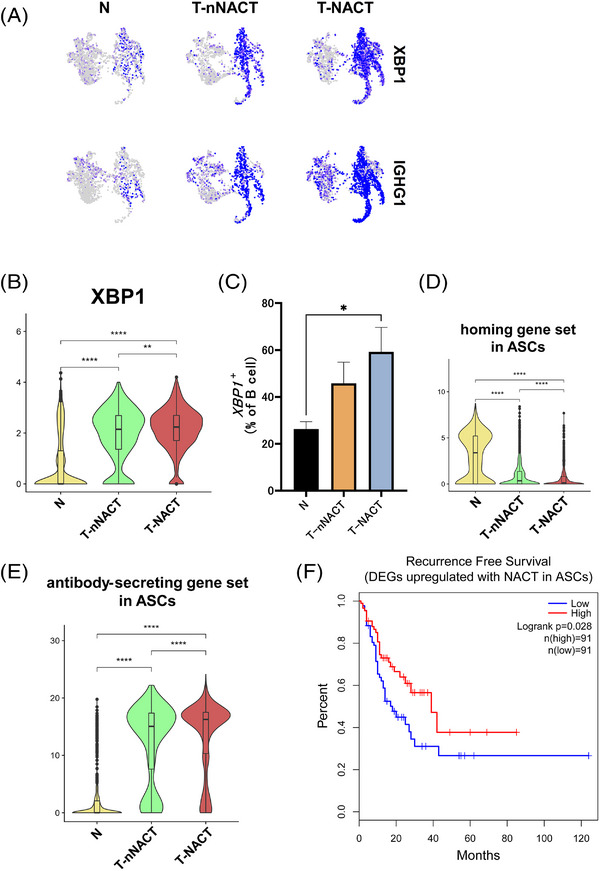
FIGURE 6.

Increase of the proportion and enhancement of functions in ASCs during chemotherapy. (A) UMAP plots showed the expression levels of XBP1 and IGHG1, which are the canonical marker genes for antibody‐secreting cells (ASCs), by the tissue source type. B) Violin plots showed the expression of XBP1 in ASCs by the tissue source type. Significance of XBP1 expression (p‐value) between tissue source type was determined by Wilcoxon rank‐sum test. Boxplots included centreline, median; box limits, upper and lower quartiles; whiskers at most 1.5× the interquartile range past upper and lower quartiles. ** p < .01, **** p < .0001. (C) Bar plots showed the percentage of XBP1 + cells in total B cells by the tissue source type (N; n = 7, T‐nNACT; n = 5, T‐NACT; n = 5). Mean + SEM shown. Dunn's multiple comparisons test was performed. * p < .05. (D) Violin plots showed the expressions of the homing gene set in ASCs by the tissue source type. Significance of this gene set enrichment (p value) between tissue source types was determined by Wilcoxon rank‐sum test. Boxplots included centreline, median; box limits, upper and lower quartiles; whiskers at most 1.5× the interquartile range past upper and lower quartiles. **** p < .0001. (E) Violin plots showed the expressions of the antibody‐secreting gene set in ASCs by the tissue source type. Significance of this gene set enrichment (p value) between tissue source types was determined by Wilcoxon rank‐sum test. Boxplots included centreline, median; box limits, upper and lower quartiles; whiskers at most 1.5× the interquartile range past upper and lower quartiles. **** p < .0001. (F) Survival analysis based on DEGs up‐regulated with NACT in ASCs using TCGA‐ESCA data (n = 182). Log‐rank Mantel Cox–test.
