FIGURE 7.

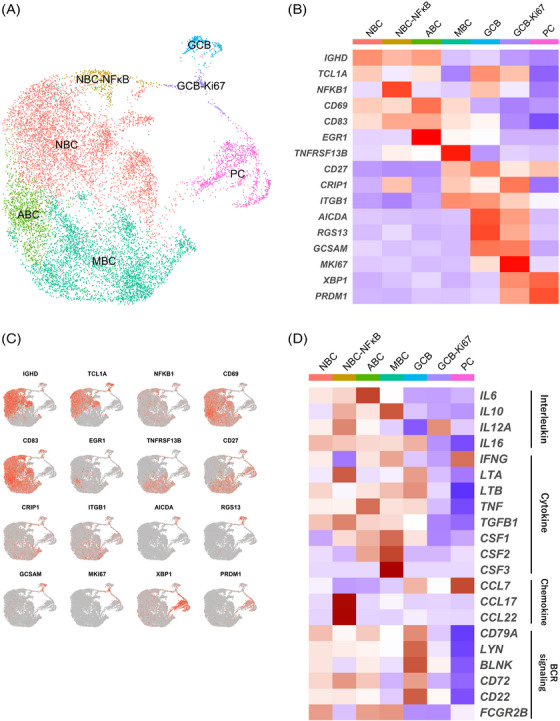
The subtypes of B cells in LNs. (A) UMAP plot was color‐coded by seven subtypes of B cells in LNs on the basis of representative genes. (B) Heatmap showed representative genes of B cells in each subtype. (C) UMAP plots showed the expressions of representative genes. (D) Heatmap showed the expression of B cell function‐associated genes in each subtype.
