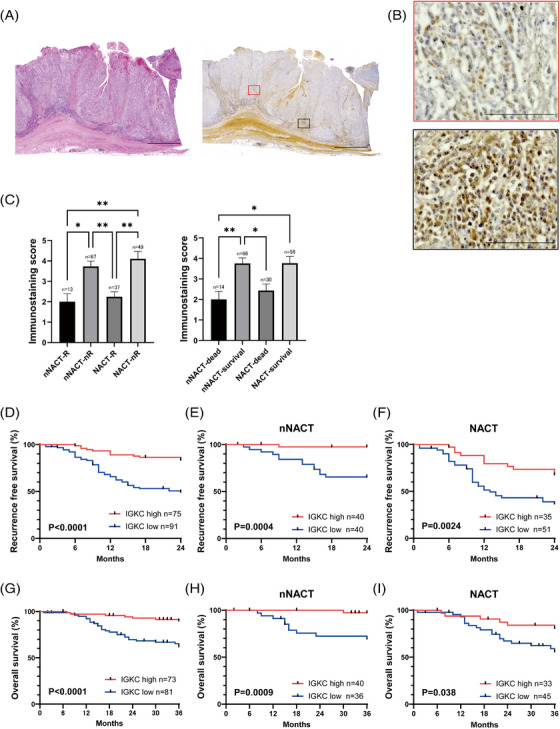
FIGURE 9.

The relationship between ASCs in the TIME and prognosis in ESCC patients. (A) Representative images of H&E staining (left) and IGKC immunostaining (right), which were merged using image‐joint software. Scale bars, 3500 μm. (B) Representative images of IGKC immunostaining intratumour (×200, top, red) and peritumour (×200, bottom, black). Scale bars, 100 μm. (C) Expression of IGKC in 166 ESCC patients, about recurrence cases (left) and survival cases (right). Mean + SEM shown. Dunn's multiple comparisons test was performed. * p < .05, ** p < .01. (D–F) Kaplan–Meier curves for recurrence‐free survival with IGKC high or low expression in 166 ESCC patients (D), including 80 ESCC patients without NACT (E) and 86 ESCC patients with NACT (F). p Value was determined with Gehan–Breslow–Wilcoxon test. (G–I) Kaplan–Meier curves for overall survival with IGKC high expression or low expression in 154 ESCC patients (G), including 76 ESCC patients without NACT (H) and 78 ESCC patients with NACT (I). P‐value was determined with Gehan–Breslow–Wilcoxon test.
