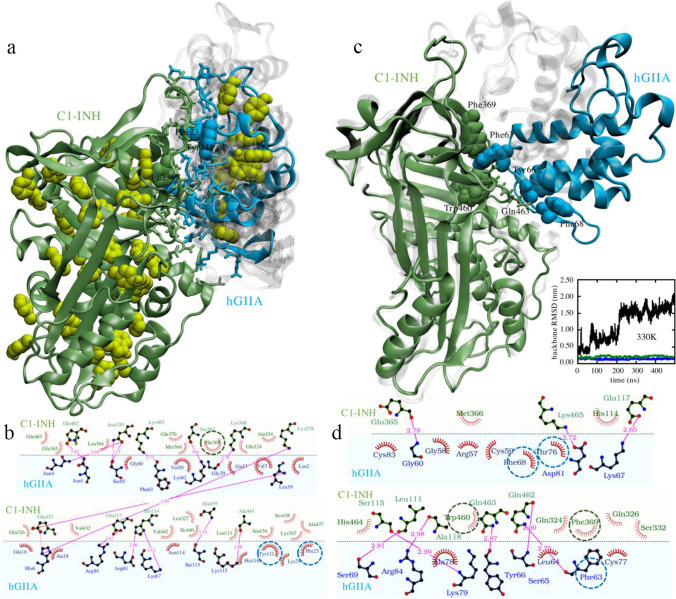
Fig. 7.
C1-INH:hGIIA complex. A Docking poses: predicted conformations of hGIIA (gray shades) on C1-INH (green); the lowest scoring hGIIA conformation is highlighted (cyan). Interacting residues are indicated (licorice) with aromatic side chains further highlighted by their van der Waals spheres. Aromatic residues not involved in the interaction are also indicated (yellow). B Schematic diagram of the interaction between C1-INH (top, green shade) and hGIIA (bottom, blue shade) in the optimum HADDOCK pose of panel A. C Molecular dynamics simulation analysis: comparison between initial (t = 0, gray shade) and final (t = 500 ns, color) configurations of C1-INH:hGIIA. Simulations were run at T = 330 K in full water solvent. Water molecules are not shown for ease of visualization. Interacting aromatic residues are highlighted with their van der Waals spheres. Gln463, forming a hydrogen bond with Tyr66, is also explicitly drawn. In the inset: the backbone RMSD of hGIIA (blue), of C1-INH (green), and of hGIIA with respect to C1-INH (black). D Schematic diagram of the interaction between C1-INH (top, green shade) and hGIIA (bottom, blue shade) in final (t = 500 ns) configurations of panel C. In A and D, all residues interacting with the target are listed; hydrogen bonds are indicated by dotted lines (magenta). The hydrogen bond distances are also indicated. Aromatic residues are highlighted (dashed circles)

