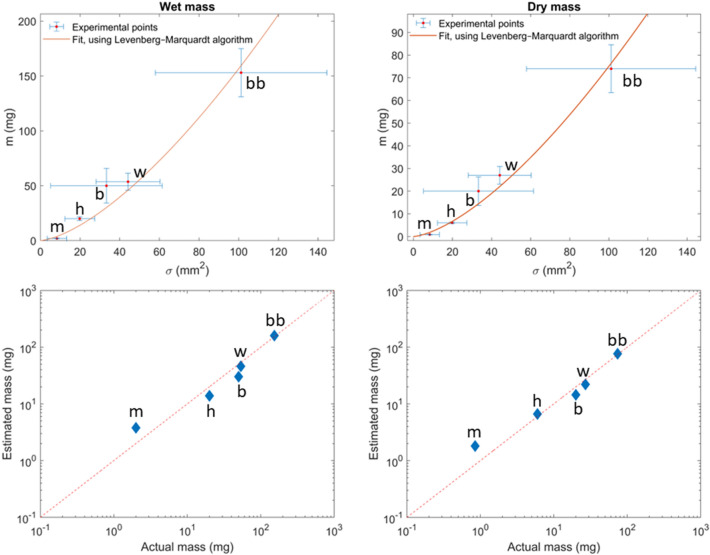
Fig. 8.
Figure A and B display the result of the fit of Eq. (5) for the wet and dry mass, respectively. Error bars represent the standard deviation. Figure C and D display the results of the estimated mass (respectfully wet and dry) using the results of the previous fit, Eqs. (7) and (8), as a function of the actual mass measured with a 0.1 mg precision scale. Each insect group is identified by a unique marker, m for Culicidae, h for Musca domestica, b for Osmia lignaria, w for Vespula maculifrons and bb for Bombus bimaculatus

