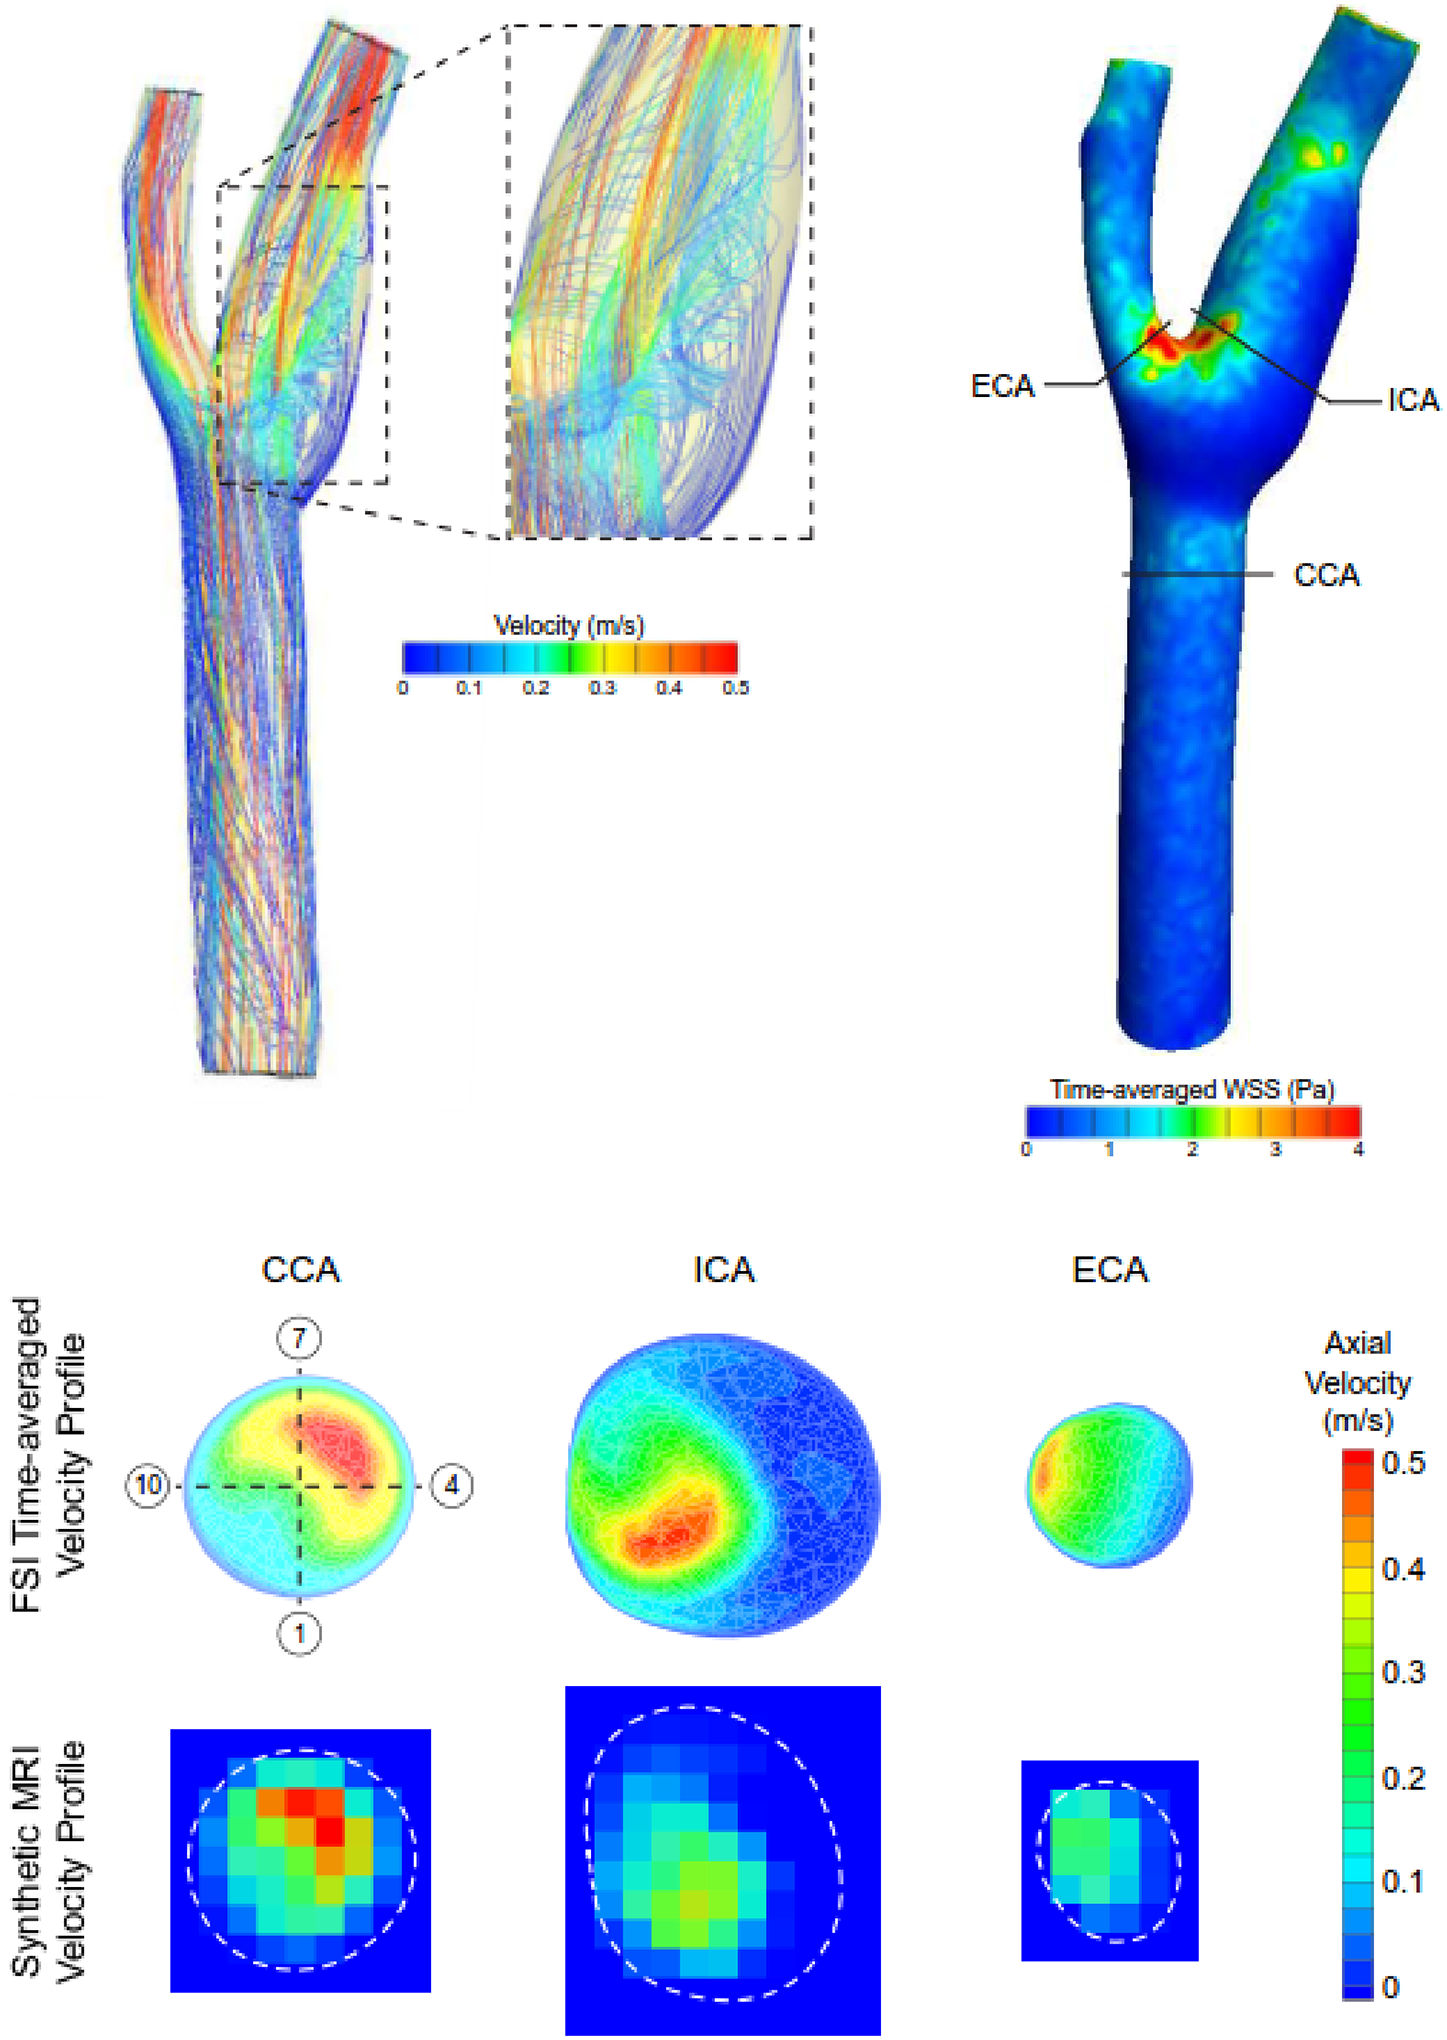
Fig. 7.

FSI model predicted flow streamlines encoded with velocity magnitude at peak systole and time-averaged WSS magnitude values in the carotid bifurcation. Solid black lines in the WSS fringe plot indicate the location where predicted velocity profiles were extracted in the common, internal, and external carotid arteries (CCA, ICA, and ECA, respectively) and resampled to generate synthetic MRI data (dashed white lines indicate wall boundary). The numbers in the open circles indicate the sector location where WSS values were calculated.
