
Figure 4. BATCH screening of p-coumaric acid over-production phenotypes.
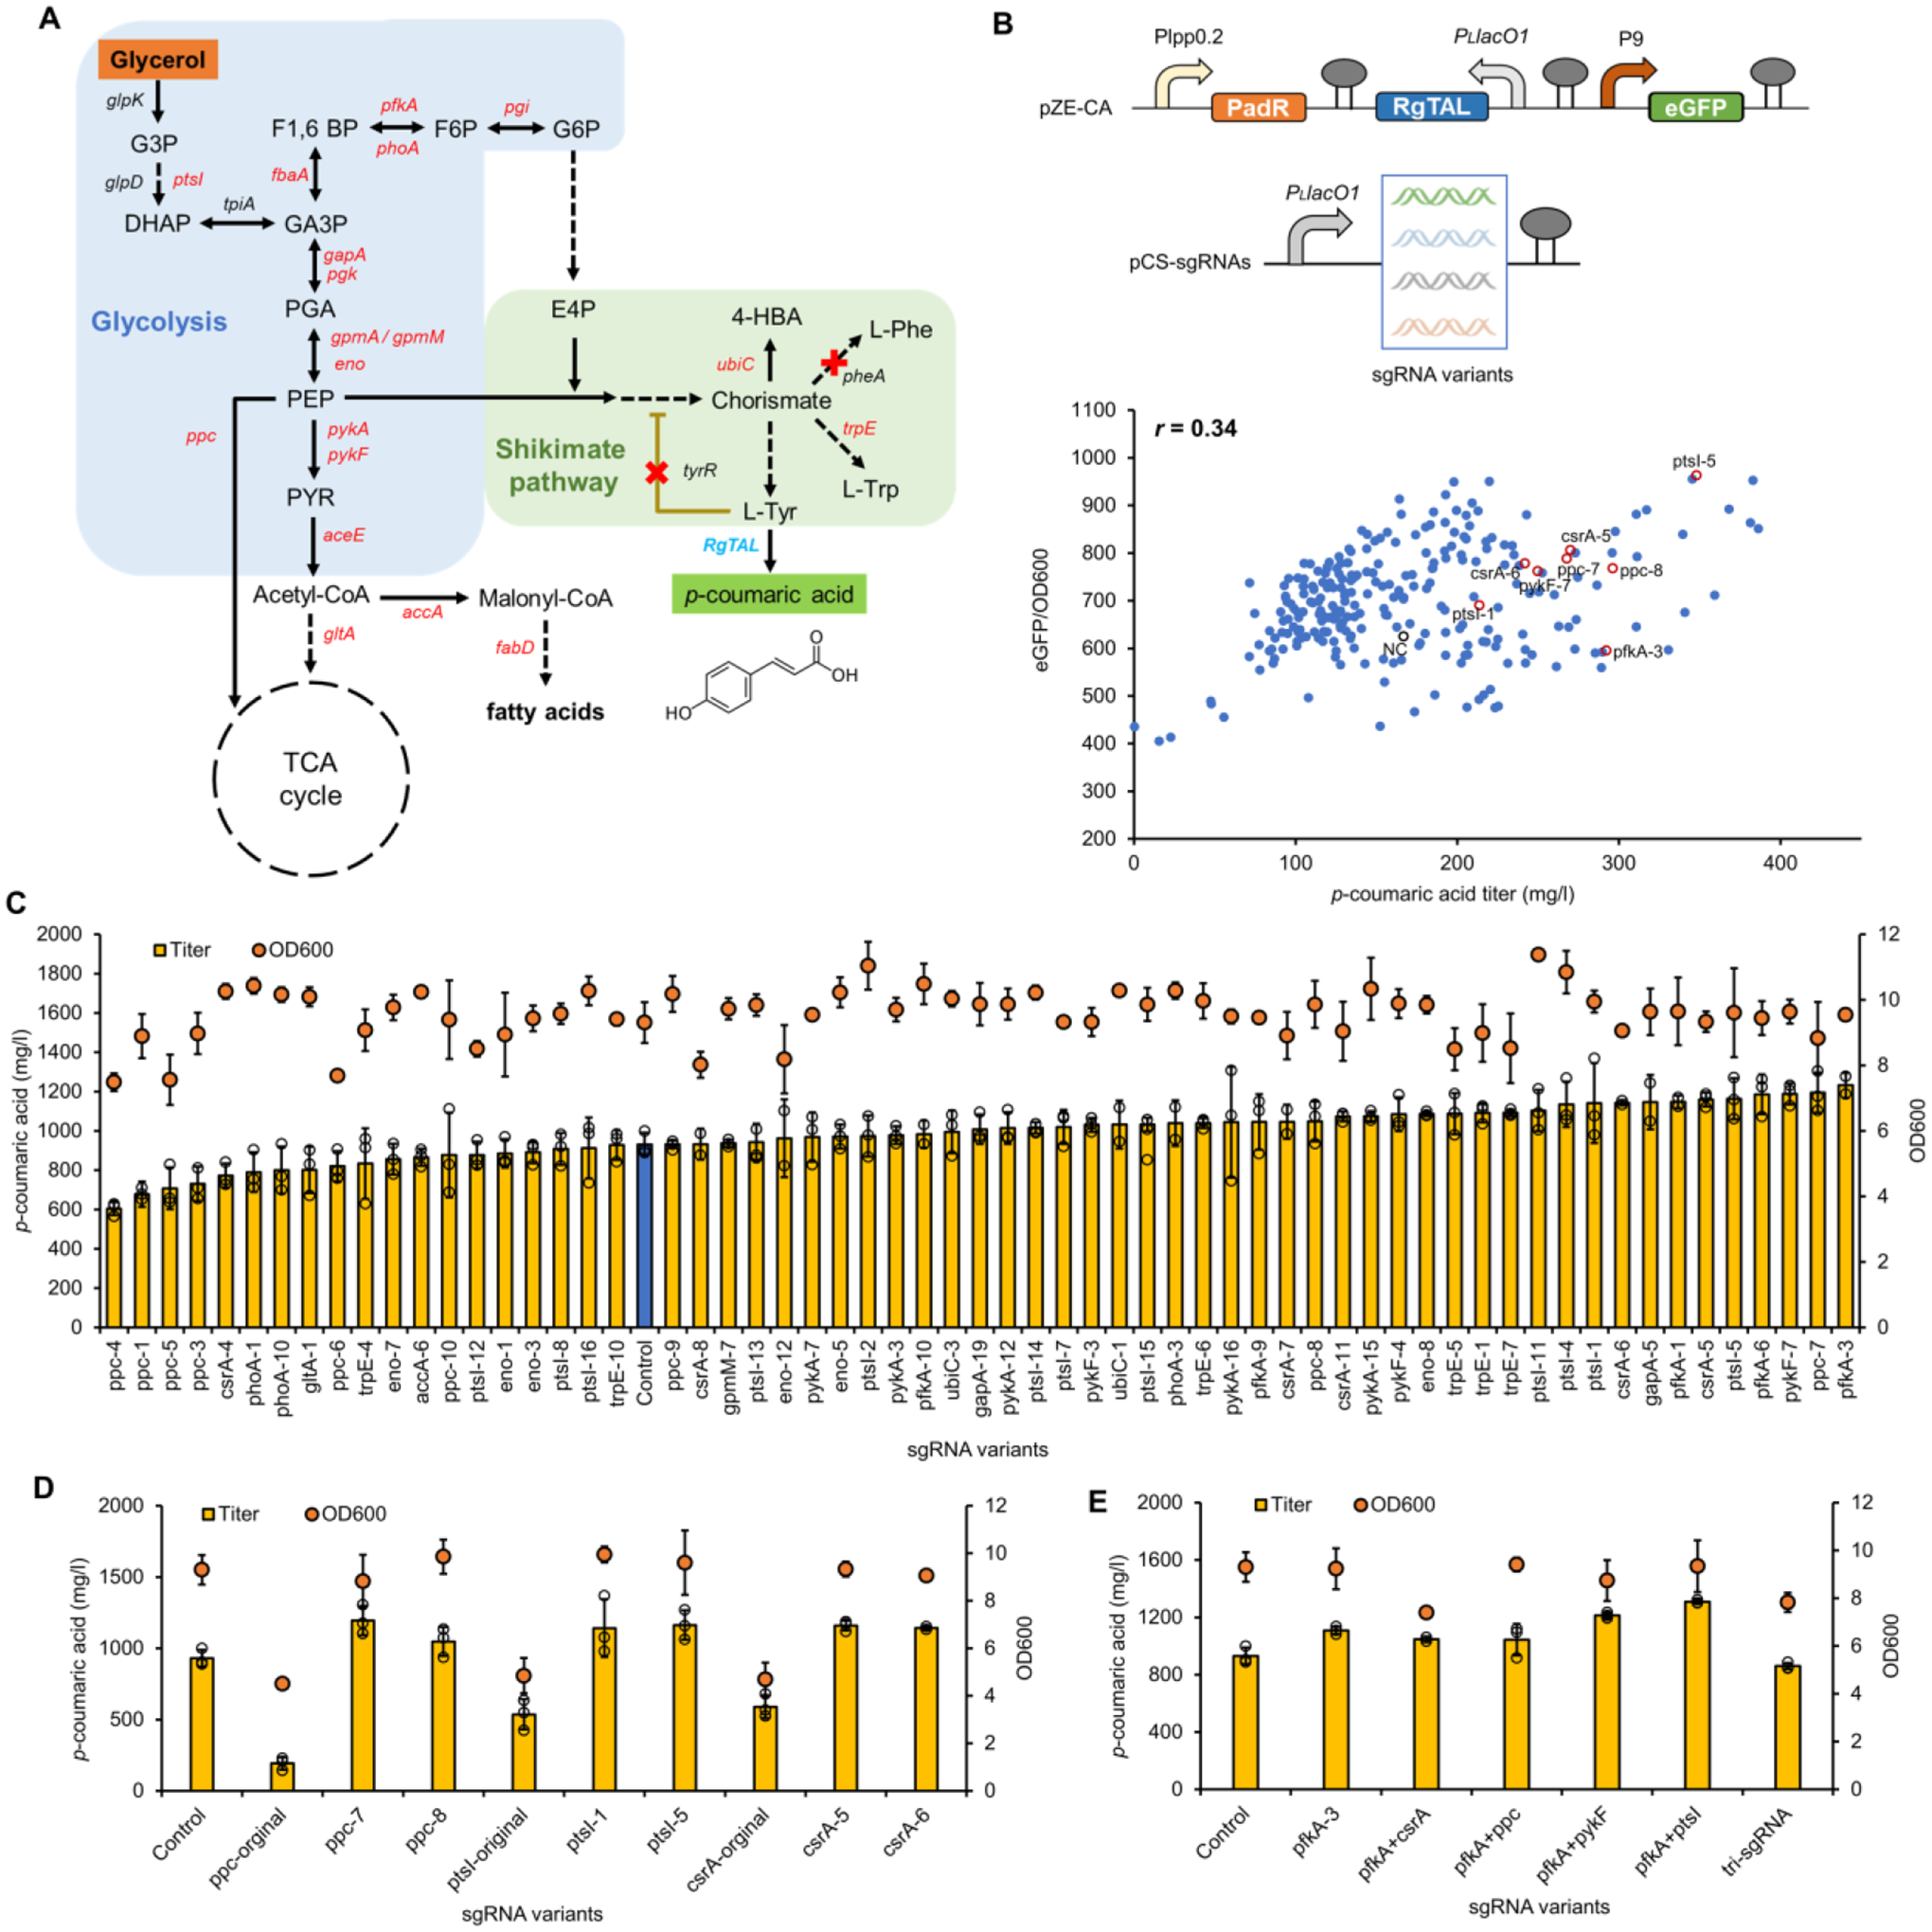
(A) The biosynthetic pathway of p-coumaric acid from glycerol. Genes marked in red are CRISPRi targets and red crosses are genes to be knocked out. (B) The correlation between p-coumaric acid titers (in test tubes) and green fluorescence intensities in E. coli∷dCas9 ΔpheA ΔtyrR with pZE-CA and pCS-sgRNA mismatch variants. p-Coumaric acid titers and normalized fluorescence intensities of the negative control strain with no sgRNA and strains with representative beneficial sgRNA variants were highlighted in black and red circles, respectively. (C) Titers of p-coumaric acid and cell densities (OD600) of p-coumaric acid producers with selected sgRNA variants in shake flasks. The blue bar represents the control strain without any sgRNA. (D) Comparison of p-coumaric acid production between authentic (fully matched) sgRNAs targeting ppc, ptsI and csrA, and their counterpart mismatch sgRNA variants in shake flasks. (E) The p-coumaric acid production test with combination of selected sgRNA variants in shake flasks. The number behind each gene name represented the order of selected colonies harboring counterpart mismatch sgRNA variants. Negative control (NC), E. coli∷dCas9 ΔpheA ΔtyrR with pZE-CA and pCS27. All data represent the mean of three biologically independent samples and error bars show standard deviation.