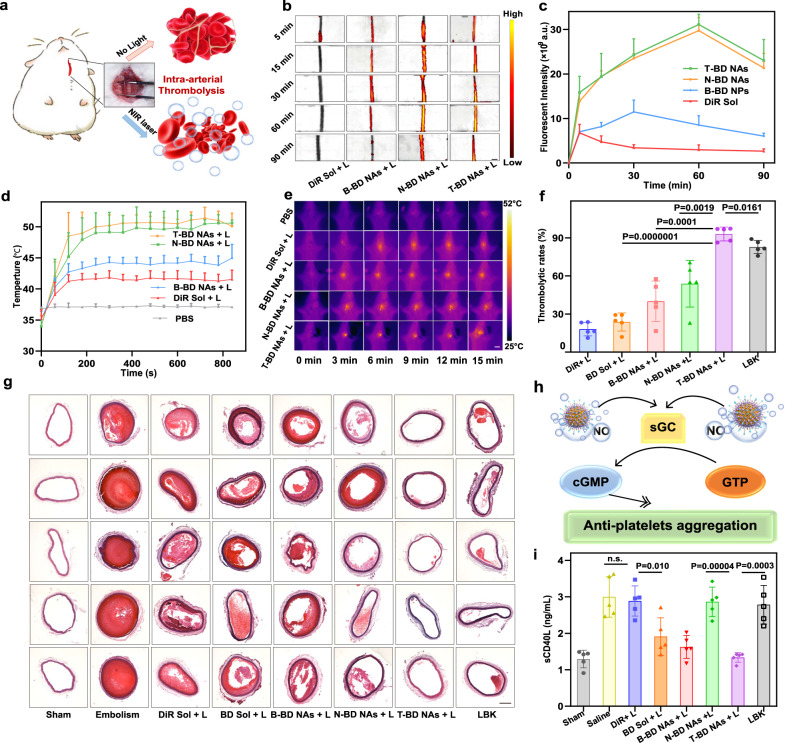
Fig. 5. Intra-arterial thrombolysis in SD rats (n = 5).
a Schematic representation of photothermal/mechanical synergistic thrombolysis effects in a FeCl3-induced rat carotid arterial thrombosis model. b Representative fluorescence images (scale bar = 2 mm) and c quantitative results of the carotid artery embolic vessels after intravenous injection of DiR Sol, B-BD NAs, T-BD NAs, or N-BD NAs at an equivalent DiR dose of 5 mg/kg. Data are presented as mean ± SD. Source data are provided as a Source Data file. In vivo photothermal heating curves d and images e of carotid artery thrombotic vessels under 808 nm laser irradiation (2.0 W/cm2, 15 min), scale bar = 2 cm. Data are presented as mean ± SD. Source data are provided as a Source Data file. f Nonpharmaceutical thrombolysis rates of carotid arterial vessel sections after various treatments, quantitatively analyzed by software Image-pro plus. Data are presented as mean ± SD. Source data are provided as a Source Data file. One-way ANOVA (one-sided) with Dunnett’s multiple comparisons test was used for the analysis of data and adjusted P value. g Nonpharmaceutical thrombolysis results of carotid arterial vessels sections after various treatments, scale bar = 100 μm. h Schematic diagram of NO-mediated thrombolysis mechanism: antiplatelet aggregation. i The sCD40L levels in the blood samples of rats after various treatments. Data are presented as mean ± SD. Source data are provided as a Source Data file. One-way ANOVA (one-sided) with Dunnett’s multiple comparisons test was used for the analysis of data and adjusted P value. The n.s. represent no significance.

