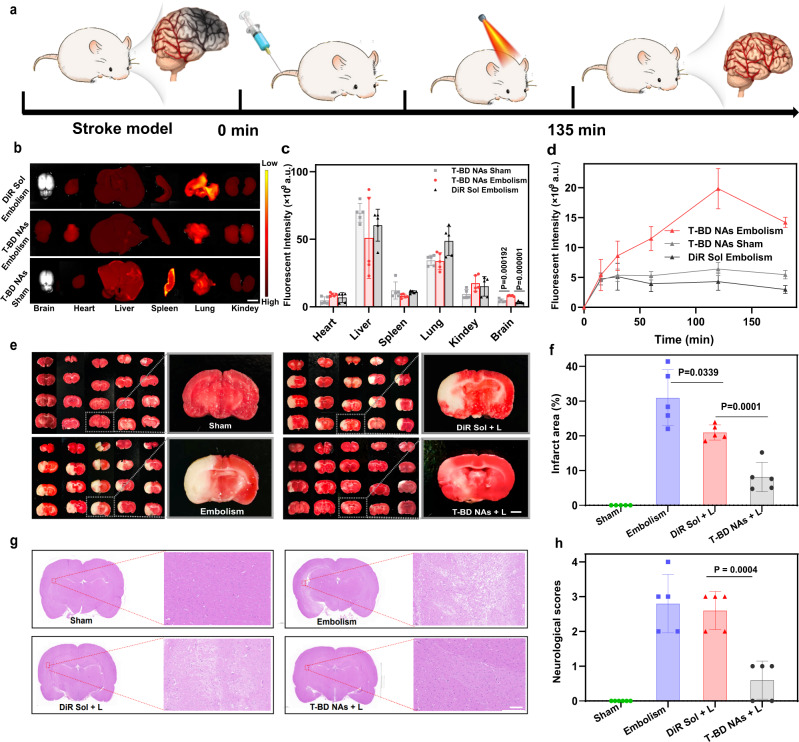
Fig. 7. Ischemic stroke salvage (n = 5).
a Treatment scheme in ischemic stroke salvage. b Representative tissue fluorescence imaging images of the MCAO model rats (Embolism) and health rats (Sham) after intravenous injection of T-BD NAs and DiR Sol, scale bar = 1 cm. c Fluorescence quantitative results of major organs in the MCAO model rats (Embolism) and health rats (Sham). Data are presented as mean ± SD. Source data are provided as a Source Data file. One-way ANOVA (one-sided) with Dunnett’s multiple comparisons test was used for the analysis of data and adjusted P value. d Brain fluorescence quantitative results of T-BD NAs and DiR Sol in the MCAO model rats (Embolism) and health rats (Sham) after intravenous injection. Data are presented as mean ± SD. Source data are provided as a Source Data file. e Representative photographs of TTC-stained brain slices of Sham group, Embolism group (0.9% NaCl), DiR Sol + L group (2 W/cm2, 15 min), and T-BD NAs + L group (2 W/cm2, 15 min), the infarct area is observed as white, scale bar = 1 mm. f Brain infarct volumes of the Sham group, Embolism group (0.9% NaCl), DiR Sol + L group (2 W/cm2, 15 min) and T-BD NAs + L group (2 W/cm2, 15 min), respectively. Data are presented as mean ± SD. Source data are provided as a Source Data file. One-way ANOVA (one-sided) with Dunnett’s multiple comparisons test was used for the analysis of data and adjusted P value. g Representative H&E staining results of the brain tissues in the Sham group, Embolism group (0.9% NaCl), DiR Sol + L group (2 W/cm2, 15 min), and T-BD NAs + L group (2 W/cm2, 15 min), respectively. h Neurological scores of the rats in the Sham group, Embolism group (0.9% NaCl), DiR Sol + L group (2 W/cm2, 15 min), and T-BD NAs + L group (2 W/cm2, 15 min), respectively. Data are presented as mean ± SD. Source data are provided as a Source Data file. One-way ANOVA (one-sided) with Dunnett’s multiple comparisons test was used for the analysis of data and adjusted P value.

