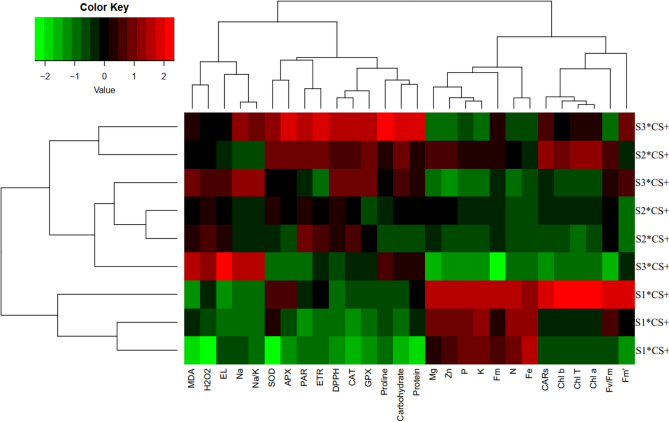
Figure 6.
Heat map (a), loading biplot of the evaluated traits (b) and Principal component analysis heat map (C) of the enzymatic antioxidants pool, the biochemical changes, chlorophyll fluorescence and nutrient elements content in Vitis Vinifera cv. ‘Sultana’ under salinity stress with application CS-SA NCs. Heat map representing of Chlorophyll a (Chl a), Chlorophyll b (Chl b), Total chlorophyll (Total Chl), Carotenoids (CARs), Electrolyte leakage (EL), Malondialdehyde (MDA), H2O2 content, Proline content, Carbohydrate (Carb), Total soluble protein content, Superoxide dismutase (SOD) activity, Ascorbate peroxidase (APX) activity, Guaiacol peroxidase (GPX) activity, catalase (CAT), total antioxidant (DPPH), nitrogen (N), phosphorus (P), potassium (K), magnesium (Mg), zinc (Zn), iron (Fe), sodium (Na), Na/K, (PAR), (Fm'), electron transport rate (ETR), maximal fluorescence (Fm), maximum photochemical quantum yield of photosystem II (Fv/Fm).

