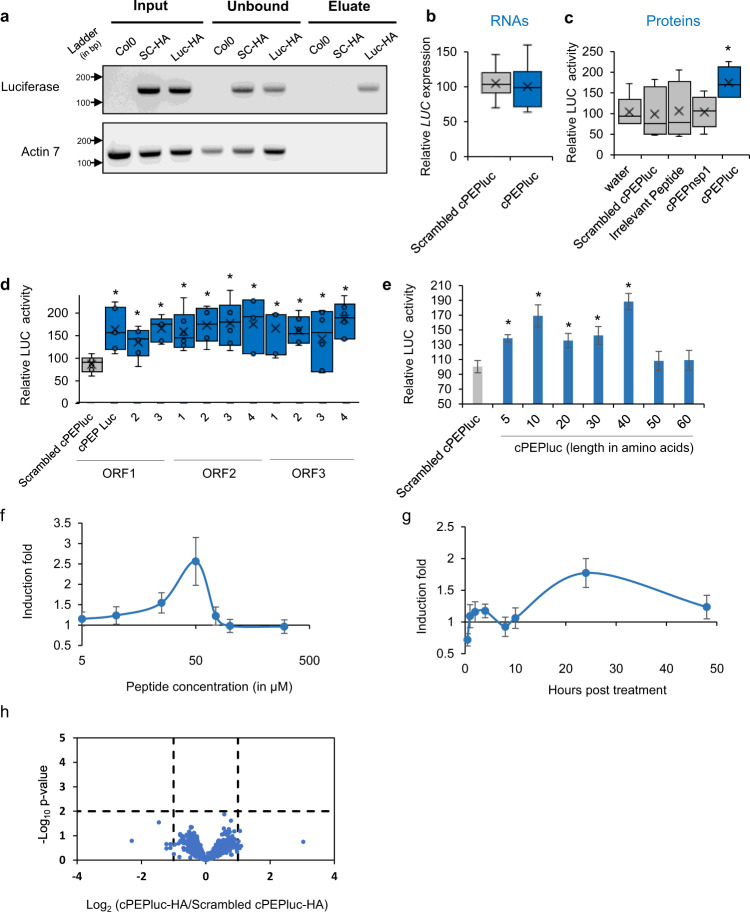
Fig. 1. Complementary peptides increase protein expression.
Analysis of luciferase expression in A. thaliana plants constitutively expressing LUC transgene. a Agarose gel after PCR amplification of RNA immunoprecipitation using anti-HA magnetic beads followed by RT-PCR, on plants treated with the indicated peptide (SC-HA: Scrambled cPEPluc-HA; Luc-HA: cPEPluc-HA). b Relative expression of luciferase transgene in plants treated with the indicated peptide, quantified by RT-qPCR. c–e Relative LUC quantification of plants treated with the indicated peptide. f, g Ratio of induction of LUC quantification of plants treated with cPEPluc compared to plants treated with a scrambled cPEPluc, using various concentrations of peptides (f) or harvested at a different time point (g). h Proteomic analysis of plants treated with cPEPluc-HA compared to plants treated with scrambled cPEPluc-HA. For box plots, the cross represents the mean, the line shows the median value, and the upper part and lower part of the box represent the first and third quartiles. The error bars represent the minimal and maximal value for box plots and the standard error of the mean (SEM) for others. The asterisks indicate significant differences between the test and the control (p < 0.05). Asterisks indicate a significant difference between the test condition and the control according to the Wilcoxon test (a, h n = 5; b–d n = 6; e n = 8; f, g n = 12; p < 0.05). Source data are provided as a Source Data file.

