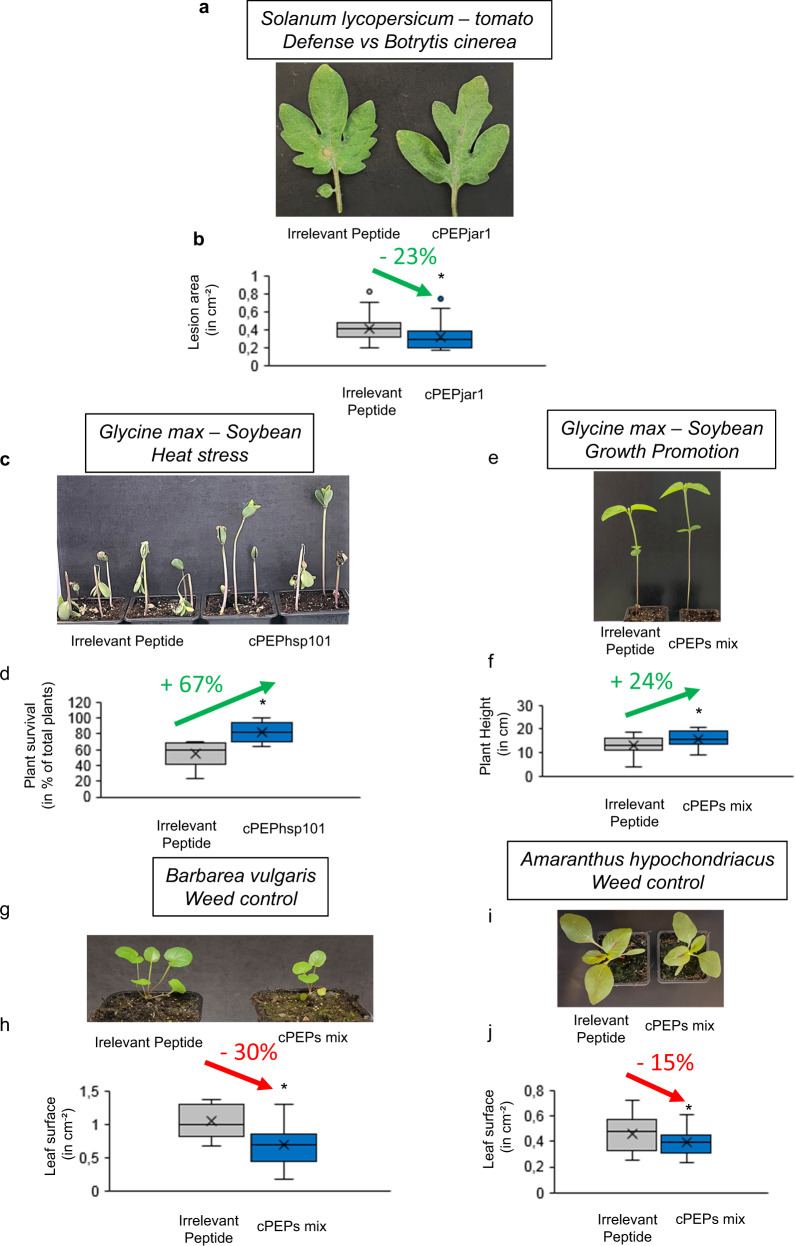
Fig. 5. cPEPs are useful tools in agronomy.
a, b Relative lesion area of S. lycopersicum leaves infected with B. cinerea and treated with an irrelevant peptide or cPEPjar1. c, d Resistance to heat stress of soybean plants treated with an irrelevant peptide or cPEPhsp101. e, f Growth (plant height) of soybean plants treated with an irrelevant peptide or a mixture of cPEPs (targeting MRB1, SHY2, and SGR1). g, h Leaf surface of B. vulgaris plants treated with an irrelevant peptide or a mixture of cPEPs (targeting EIN2, BRI1, BAK1, and WUS). i, j Leaf surface, of A. hypochondriacus plants treated with an irrelevant peptide or a mixture of cPEPs (targeting EIN2, BRI1, BAK1, and WUS). For box plots, the cross represents the mean, the line shows the median value, and the upper part and lower part of the box represent the first and third quartile. The error bars represent the minimal and maximal value for box plots and the standard error of the mean (SEM) for others. Asterisks indicate a significant difference between the test condition and the control according to the Student t-test (b, d, f, h, j n = 40; p < 0.05). Source data are provided as a Source Data file.

