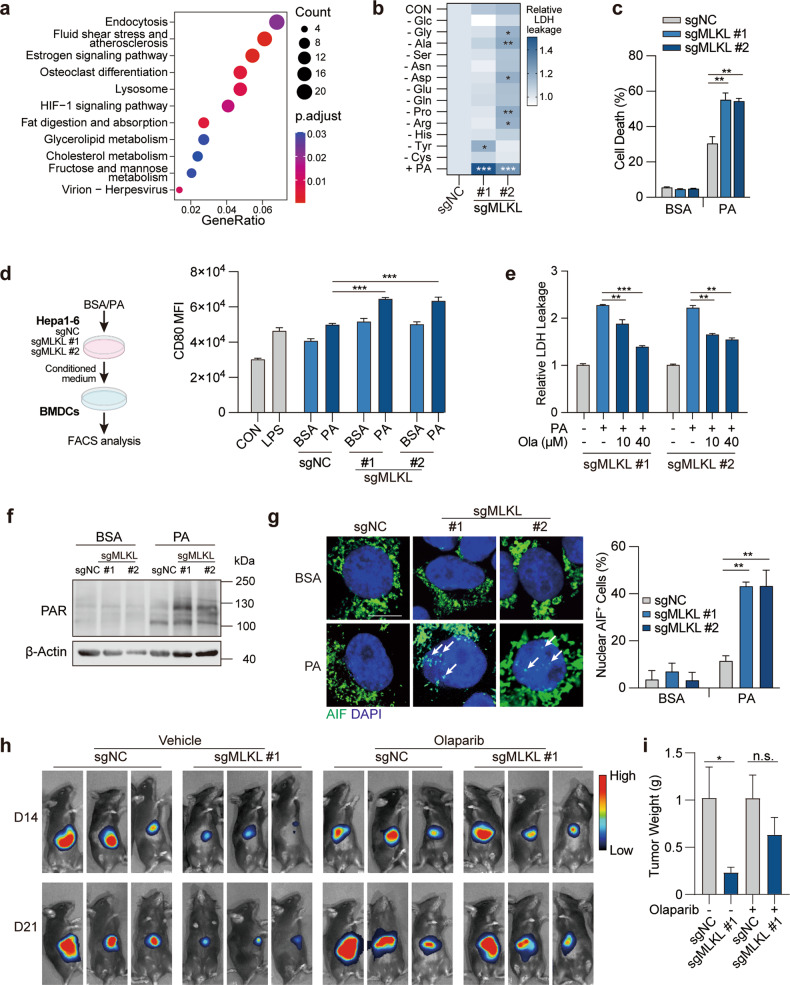
Fig. 3. MLKL deficiency enhances metabolic stress-induced parthanatos.
a KEGG pathway enrichment analysis of transcriptome data. MLKL-KO Hepa 1–6-luc (sgMLKL) or control (sgNC) cells were orthotopically implanted in the liver of C57BL/6 mice. Tumors collected at the endpoint of the study were subjected to RNA-seq analysis. b Cell death upon metabolic stress in HCC cells. MLKL-KO and control Hepa 1–6 cells were challenged with indicated nutrient deprivation or lipid stress (0.2 mM PA) for 24 h and cell death was measured by LDH leakage. c Cell death induced by PA. MLKL-KO and control Hepa 1–6 cells were treated with BSA or 0.2 mM PA for 24 h. Cell death was measured by SYTOX Green assay. d Dendritic cell activation. MLKL-KO Hepa 1–6 and control cells were treated with or without PA (0.2 mM, 24 h) and supernatant was collected as conditioned medium. BMDCs isolated from C57BL/6 mice were treated with conditioned medium for 24 h. Left, schematic diagram of the assay. Right, CD80 expression was analyzed using flow cytometry analysis. e PARP inhibition reverses cell death in MLKL-deficient cells. MLKL-KO and control Hepa 1–6 cells were treated with 0.2 mM PA and/or Olaparib at indicated concentrations for 24 h. f Immunoblotting analysis of PAR polymer accumulation. MLKL-KO and control Hepa 1–6 cells were treated with BSA or 0.2 mM PA for 20 h and then analyzed by immunoblotting. g AIF staining. Cells were treated as in f and AIF was stained using immunofluorescence. Left, representative images, scale bar, 10 μm. Arrows indicate AIF staining in the nucleus. Right, quantification of nuclear AIF positive cells. h Orthotopic tumor growth of MLKL-KO and control murine HCC cells. Cells were orthotopically implanted in the liver of C57BL/6 mice (n = 6). Mice were treated with or without Olaparib (50 mg/kg) daily. Tumor growth was monitored by whole-animal imaging. Shown were representative luminescent images. i Endpoint tumor weight as in h. Data are represented as means ± SEM. Two-tailed Student’s t-test was used for statistical analysis. ns, not significant; *P < 0.05, **P < 0.01, ***P < 0.001.

