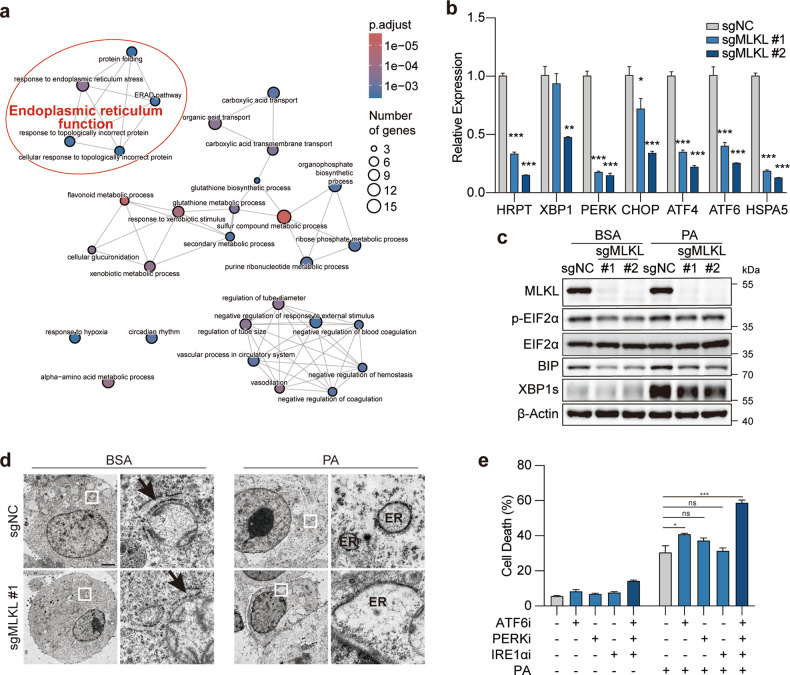
Fig. 4. MLKL deficiency leads to ER dysfunction in HCC cells.
a GO pathway enrichment analysis. MLKL-KO Hepa 1–6-luc (sgMLKL) or control (sgNC) cells were treated with BSA or 0.2 mM PA for 12 h and cells were collected for RNA-seq analysis. b, c mRNA and protein level validation of genes involved in ER stress. MLKL-KO Hepa 1–6 and control cells were subjected to qPCR analysis (b). Cells treated with BSA or PA (0.2 mM, 12 h) were subjected to immunoblotting analysis (c). d Transmission electron microscopy of ER. MLKL-KO Hepa 1–6-luc and control cells were treated with BSA or 0.2 mM PA for 4 h. Shown are representative images, scale bar, 200 nm. Arrows indicate ER. e Cell death analysis. Hepa 1–6 cells were pretreated with indicated inhibitors for 2 h and then challenged with 0.2 mM PA for 24 h and cell death was analyzed by SYTOX Green assay. Ceapin-A7 as ATF6 inhibitor (ATF6i, 20 μM), GSK2606414 as PERK inhibitor (PERKi, 20 μM) and 4μ8C as IRE1α inhibitor (IRE1αi, 20 μM). Data are represented as means ± SEM. Two-tailed Student’s t-test was used for statistical analysis. ns, not significant; *P < 0.05, **P < 0.01, ***P < 0.001.

