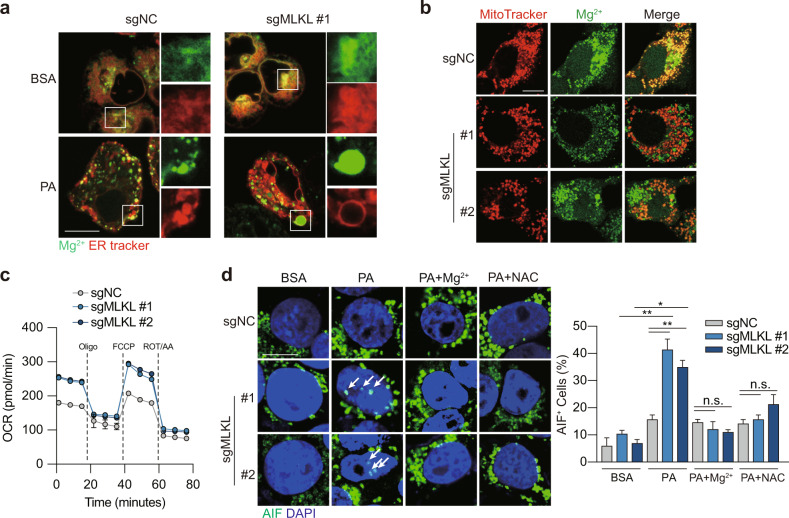
Fig. 5. MLKL deficiency disrupts Mg2+ homeostasis in the ER.
a Mg2+ signaling in ER. MLKL-KO Hepa 1–6 and control cells were treated with BSA or 0.2 mM PA for 12 h. ER Mg2+ signal was visualized by co-staining the cells using ER Tracker and Mag-Fluo4-AM. Shown were representative fluorescent images, scale bar, 10 μm. b Mg2+ signal in mitochondria. Cells were treated as in a. Mitochondrial Mg2+ signal was visualized by co-staining the cells using MitoTracker and Mag-Green-AM. Shown were representative fluorescent images, scale bar, 10 μm. c Oxygen consumption rate (OCR) measurement. Cells were treated as in a. Oligomycin (Oligo, 2 μM), FCCP (1 μM) and rotenone/antimycin (ROT/AA, 0.5 μM) were added as indicated. d AIF staining. MLKL-KO Hepa 1–6 and control cells were pretreated with Mg2+ (MgCl2, 10 mM) or N-acetyl-L-cysteine (NAC, 2 mM) for 1 h followed by treatment with BSA or 0.2 mM PA for 12 h. Left, representative images, scale bar, 10 μm. Arrows indicate AIF staining in the nucleus. Right, quantification of nuclear AIF positive cells. Data are represented as means ± SEM. Two-tailed Student’s t-test was used for statistical analysis. ns, not significant; *P < 0.05, **P < 0.01, ***P < 0.001.

