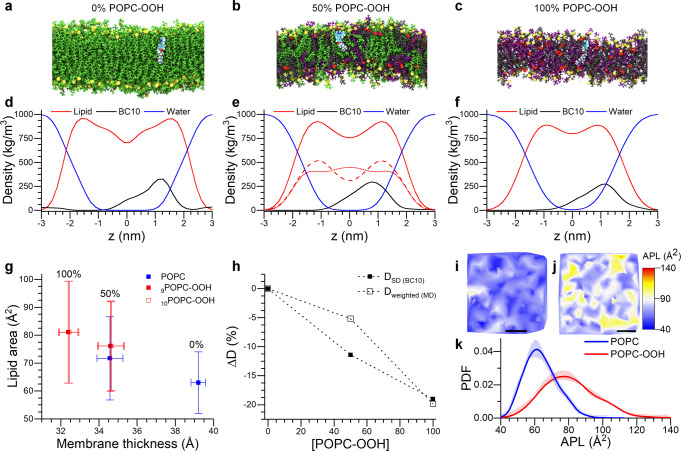
Fig. 6. MD simulations of POPC-OOH containing membranes.
a–c Lateral snapshots of the simulated bilayers containing increasing amounts of POPC-OOH. Colour coding: Green-POPC, Gray-oxPOPC9, Purple-oxPOPC10 (see Fig. S15 for details), Yellow-Phosphorous, Red-Oxygen. BC10 is also shown (cyan), within the leaflet regardless of the membrane’s composition, but closer to the phospholipid headgroups in the 100% POPC-OOH membrane. d, f Electron density profiles of membranes containing increasing amounts of POPC-OOH. In (e) the red traces correspond to all lipids (continuous trace), POPC (dotted) and POPC-OOH (dashed). g Area-thickness relationship for lipid peroxide containing bilayers. Data shown as mean ± S.D. from two independent simulations. h Relative variation of the 2-dimensional diffusion coefficient obtained from the MD simulations (⎕) and from molecular rotor data using the Saffman-Delbrück equation (∎). i, j Snapshots of a coarse-grained simulation showing the area per lipid (APL) maps of pure POPC (i) and POPC-OOH (j) membranes. Scalebar: 30 nm. k Bimodal APL distribution seen for the oxidized membranes (j), supporting the observation of lipid segregation in POPC-OOH membranes.

