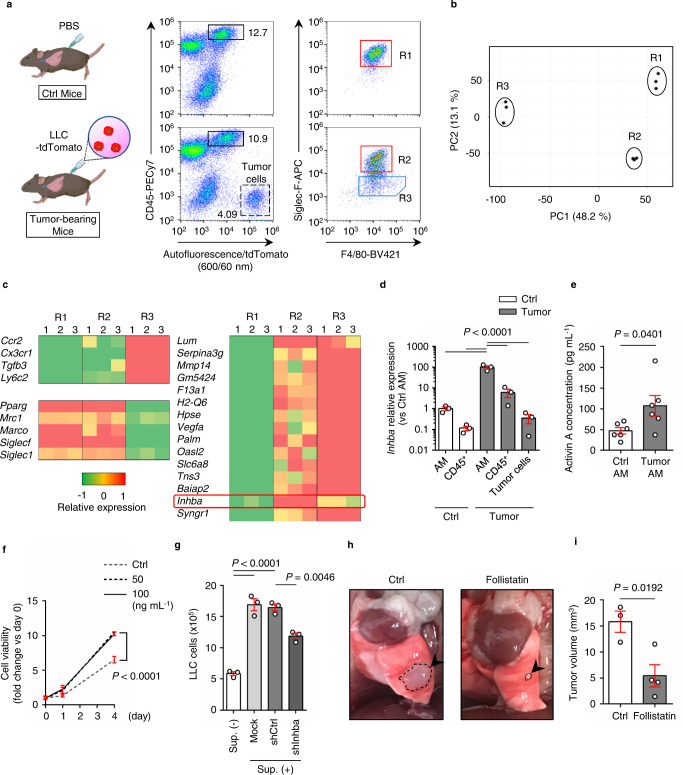
Fig. 2. INHBA upregulation in lung alveolar macrophages (AMs) enhances proliferation of lung cancer cells in vivo.
a Definitions of R1, R2, and R3 cells in the lungs of the control and tumor-bearing mice. Left images show schematic diagram of control (Ctrl) mice with PBS (upper) or tumor-bearing mice with LLC cells fluorescently labeled with tdTomato (lower). Dot plots on the right indicate the analysis result of CD45+ autofluorescence+ cells (black rectangular regions in the middle dot plots). The red rectangular region and blue pentagonal region indicate AMs and TAMs, respectively. The data are representative of three independent experiments with similar results. b Principal component analysis of R1, R2, and R3 cells by RNA-Seq (n = 3 mice for R1, R2, and R3 populations). c Heatmaps of tumor-associated macrophage marker genes and AM marker genes (left), and the top 15 upregulated genes from R1 to R2 cells (right). d RT-PCR analysis of Inhba expression in AMs and CD45+ (autofluorescence−) cells isolated from control mice, and AMs, CD45+ (autofluorescence−) cells, and tumor cells isolated from tumor-bearing mice (n = 3 mice per group). e Measurement of activin A concentration in AMs sorted from control or tumor-bearing mice using ELISA (n = 6 per group). f WST-1 cell proliferation assay of LLC cells after administration of each dose of recombinant activin A. Viability of LLC cells in each well with or without recombinant activin A was measured on days 0, 1, and 4. Each value indicates the mean ± s.e.m. of the three wells (n = 4 per group for day 0 and day 1, n = 3 per group for day 4). g Comparison of LLC cell number after 2-day culture with or without conditioned media (Sup.) from shRNA-expressing AM cells (AMJ2-C11) (n = 3 per group). h Representative images of the left lung of tumor-bearing mice treated with PBS (left; control) and follistatin (right). Arrowheads indicate the tumor (surrounded by a dashed line). i Tumor volume of tumor-bearing mice treated with PBS (control) or follistatin (n = 3 mice for control, n = 4 mice for follistatin). Means ± s.e.m. for each group are shown. Symbols represent individual mice (d, e, i) or wells (g). Statistical significance was determined using one-way ANOVA with Bonferroni’s post hoc test (d, g) or unpaired two-tailed t-test (e, i).

