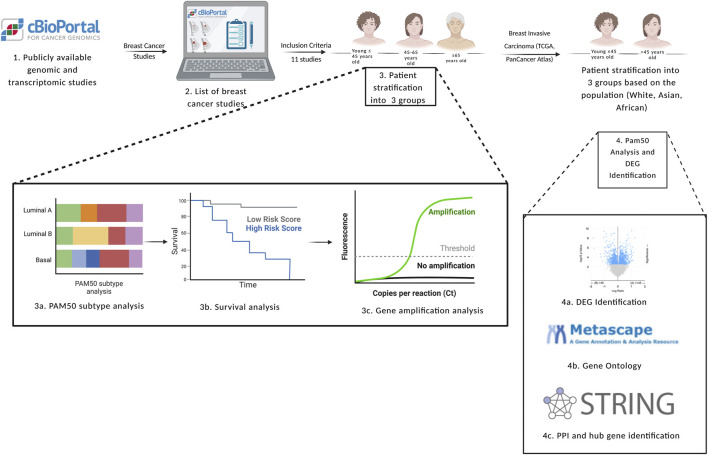
FIGURE 2.
Flowchart diagram of the inclusion and exclusion criteria used in the study, in addition to the methods used to achieve the aims of the study. DEG: differentially expressed genes, PAM50: prediction analysis of microarray 50. Created with BioRender.com.

