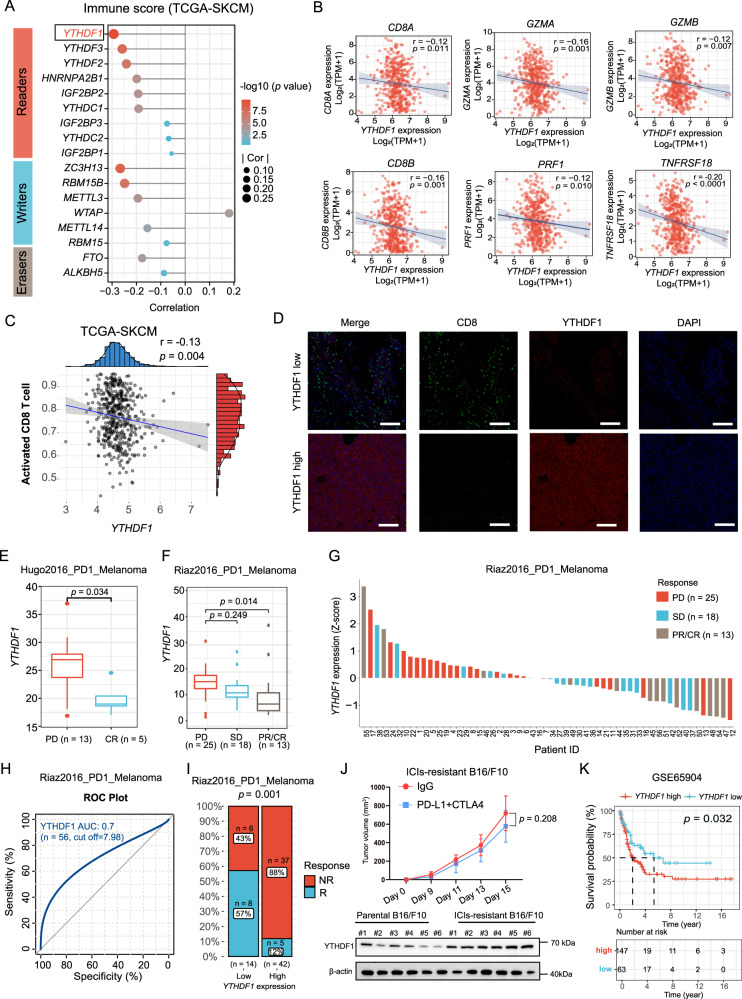
Fig. 1. YTHDF1 overexpression is associated with an “immune desert” phenotype and resistance to ICI therapy.
A Correlations of m6A regulator expression with immune scores in the TCGA skin cutaneous melanoma (TCGA-SKCM) dataset (n = 471 biologically independent samples). Two-tailed Spearman correlation is reported. B Scatter plot presenting the correlation of YTHDF1 with activated CD8+ T-cell-related gene expression. The expression levels were log2(TPM+1) derived from 471 TCGA melanoma samples. Two-tailed Spearman correlation is reported. C Scatter plot presenting the correlation between YTHDF1 and activated CD8 T cell score. Two-tailed Spearman correlation is reported. D Immunofluorescence staining for YTHDF1 protein expression (red) and CD8 T-cell infiltration (green) using a melanoma tissue microarray. Representative immunofluorescence images of 48 independent melanoma tissues. Scale bar, 100 μm. E, F Box plots showing the differential expression of YTHDF1 in progressive disease (PD), stable disease (SD), partial response (PR), and complete response (CR) samples using RNA-sequencing data from E Hugo2016_PD1_Melanoma cohort24 (n = 18 biologically independent samples) and F Riaz2016_PD1_Melanoma cohort25 (n = 56 biologically independent samples). The upper, middle and lower horizontal lines of the box represent the upper, median and lower quartile respectively. Whiskers depict the smallest or largest values within 1.5-fold of the interquartile range, and the points outside the box represent outliers. Two-tailed unpaired Student’s t-test (E) and Kruskal–Wallis with Dunn’s multiple comparison test (F) are reported. G A waterfall plot depicting YTHDF1 expression (z score) for the PD, SD and PR/CR samples in the Riaz2016_PD1_Melanoma cohort (n = 56 biologically independent samples). H ROC curve indicating the predictive value of YTHDF1. I Bar plot presenting the different response rates of ICI therapy. The blue bar represents responders (R), and the red bar indicates nonresponders (NR). Two-tailed χ2 test. J Tumor growth curves of ICIs-resistant B16/F10 cells (n = 6 biologically independent animals per group). Two-sided unpaired Student’s t-test. Data are presented as mean values ± SD. Western blot revealing YTHDF1 expression in ICIs-resistant and parental B16/F10 cells. K Kaplan–Meier OS curve for 210 melanoma patients with high or low YTHDF1 expression. Two-sided log-rank test. Source data are provided as a Source Data file.

