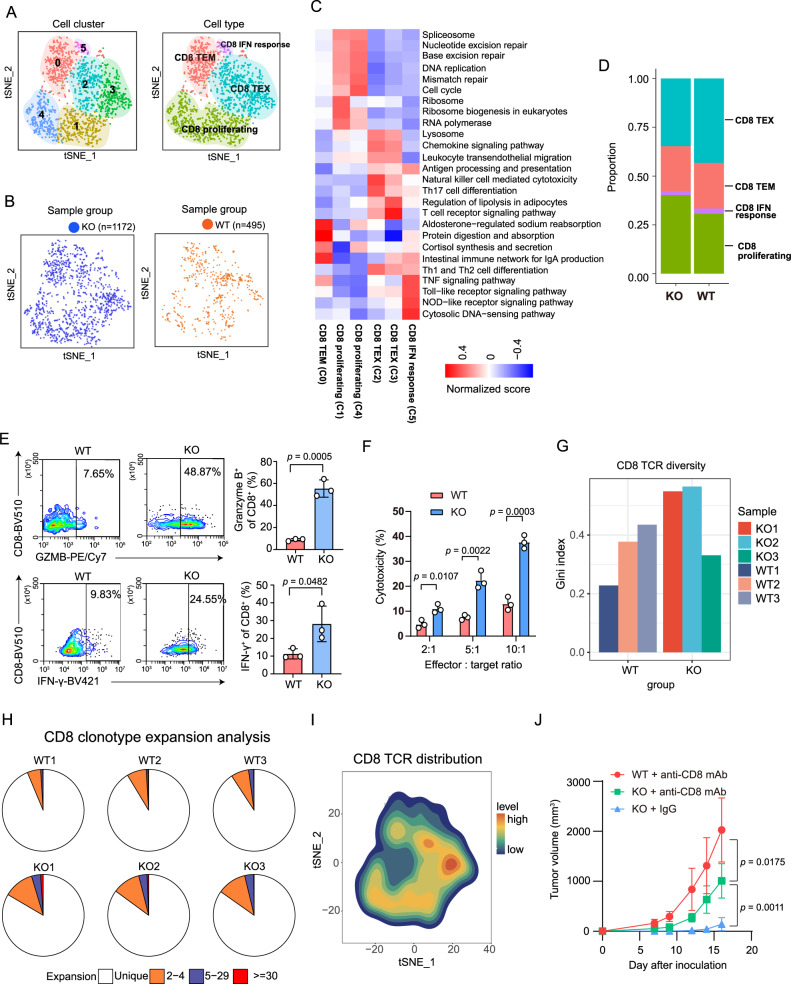
Fig. 5. scRNA-seq analysis of CD8+ T-cell subpopulations.
A, B The t-SNE plot of CD8+ T-cell subpopulations, color coded by cell cluster, cell type (A), and sample group (B). C Heatmap of differentially activated pathways among all the CD8+ T-cell clusters. D Bar plot showing the percentage of each CD8+ immune cell population in the KO and WT groups. E Flow cytometry-based quantification of IFN-γ+ or granzyme B+ CD8+ T cells. Tumor-infiltrating CD8+ T cells were restimulated with PMA and ionomycin for 6 h (n = 3 biologically independent samples per group). Two-tailed unpaired Student’s t-test. Data are presented as mean values ± SD. F In vitro cytotoxicity assays performed with activated tumor-infiltrating CD8+ T cells and B16/F10 target cells (n = 3 biologically independent samples per group). Two-tailed unpaired Student’s t-test. Data are presented as mean values ± SD. G Bar plot showing TCR diversity of CD8+ T cells. H Pie chart of CD8+ T cell clonotype expansion. I The t-SNE plot of CD8 TCR distribution. J Tumor growth curves of WT or KO tumors in C57BL/6J mice treated previously with an IgG control or anti-CD8 antibody (n = 6 biologically independent animals per group). Two-way ANOVA with Tukey’s multiple comparison test. Data are presented as mean values ± SD. The results are representative of two independent experiments. Source data are provided as a Source Data file.

