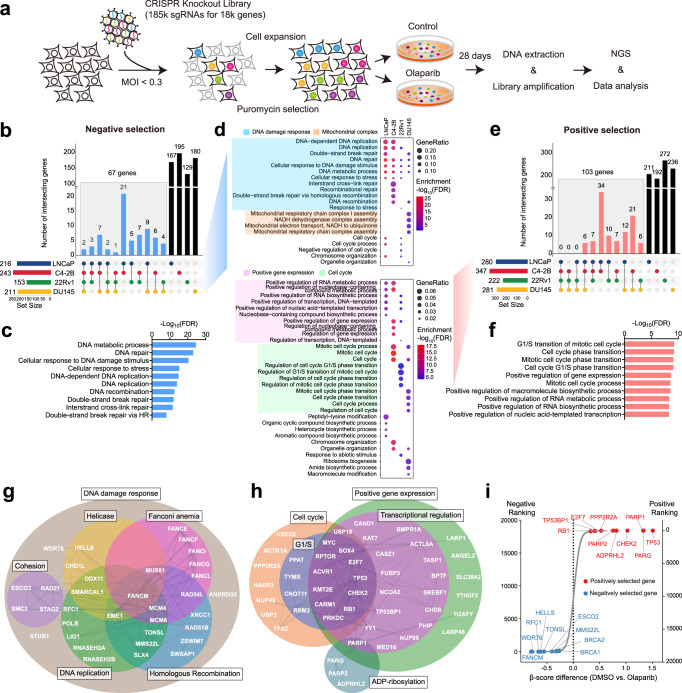
Fig. 1. CRISPR screens identify genes that modulate PARPi response in PCa cells.
a Schematic of genome-wide CRISPR/Cas9 screens. b UpSet plot110 of negatively selected genes in four PCa cell lines as indicated. Blue bars indicate the number of common hits in at least two screens. c Top GO terms enriched in 67 common hits from negative selection. d Top GO terms enriched in negatively (upper panel) and positively (lower panel) selected genes in each individual cell line. e UpSet plot of positively selected genes in four PCa cell lines as indicated. Red bars indicate the number of common hits in at least two screens. f Top GO terms enriched in 103 common hits from positive selection. g The networks of common hits from negative selection grouped according to their roles in specific pathways and their genetic and physical interactions (gray lines) based on STRING analysis. h The networks of common hits from positive selection, grouped as in (g). i Top-ranked genes from CRISPR screens determined by comparing olaparib to DMSO treatment. Genes are ranked by the average of differential β-scores from all four cell lines. Negatively and positively selected genes are marked in blue and red, respectively.

