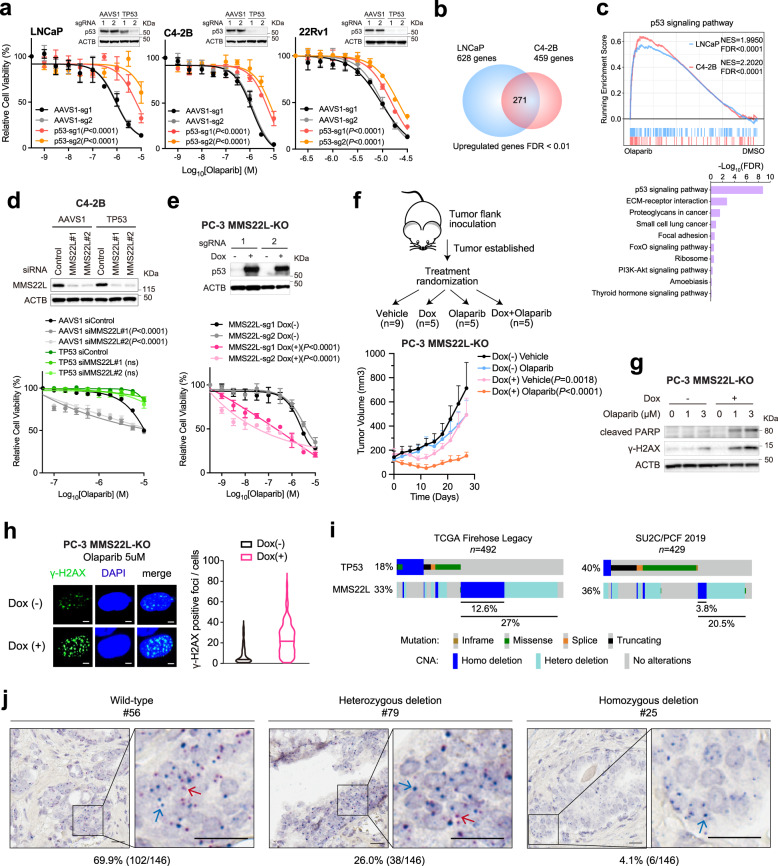
Fig. 5. TP53 status impacts PARPi response in MMS22L-depleted PCa cells.
a Dose-response curves after treatment with olaparib for the indicated cells after TP53 deletion. Immunoblot analyses of p53 in TP53-KO versus control cells are shown. b Venn diagram of up-regulated genes in LNCaP and C4-2B cells after olaparib treatment. c GSEA (upper panel) and top enriched KEGG pathways (lower panel) of up-regulated genes. Normalized enrichment score (NES) and false discover rate (FDR) are indicated. d Immunoblot analysis (upper panel) of MMS22L in AAVS1 control and TP53-KO C4-2B cells after siRNA knockdown. Dose-response curves (lower panel) after olaparib treatment for the same cells with or without MMS22L siRNA transfection. e Immunoblot analysis (upper panel) of p53 in AAVS1 control and MMS22L-KO PC-3 cells containing TET-inducible TP53 gene in the presence or absence of doxycycline (0.15 μg/ml) for 3 days. Dose-response curves (lower panel) after olaparib treatment in the presence or absence of doxycycline. f Schematic diagram of the experimental procedure (upper panel). Tumor growth (lower panel) after treatment with olaparib (50 mg/kg) or vehicle with or without doxycycline induction (n = 9, 5, 5, and 5 mice in each group, respectively). Data are presented as mean ± SD. The p-values were determined by comparing between treatment with and without doxycycline using two-way ANOVA. g Immunoblot analysis of cleaved PARP and γ-H2AX in cells after the treatment as described in (e). The experiment was repeated independently three times with similar results. h Representative images of two biologically independent experiments and quantification of γ-H2AX foci after olaparib treatment for 24 h in the presence or absence of doxycycline (0.15 μg/ml). More than 100 cells were analyzed per condition. Solid lines inside the violin indicate the median. Scale bar = 5 μm. i The frequency of TP53 and MMS22L alterations in the TCGA and the SU2C/PCF cohorts25,26. j Representative images of MMS22L wild-type, heterozygous and homozygous deletion determined by DNAscope assay using a tissue microarray (n = 146 tissue cores). Red signals (red arrow) indicate probes targeting the MMS22L gene on chromosome 6q. Blue signals (blue arrow) indicate control probes targeting the centromeric region. Scale bar = 20 μm. In (a) and (d–e), data are presented as mean ± SD (n = 3 biologically independent experiments). The immunoblot analyses were repeated independently twice with similar results. The p-values were determined using two-way ANOVA. Source data are provided as a Source Data file.

