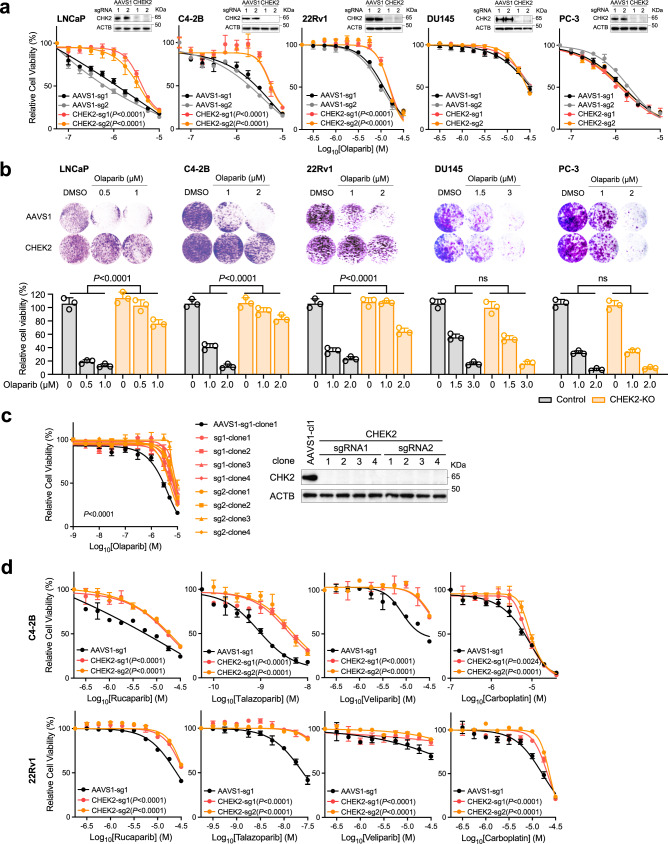
Fig. 6. Loss of CHEK2 renders PCa cells resistant to PARP inhibition.
a Dose-response curves after treatment with olaparib for two AAVS1 control (sg1 and sg2) and two CHEK2-KO (sg1 and sg2) LNCaP, C4-2B, 22Rv1, DU145, and PC-3 cell lines. The upper right panel in each cell line is the immunoblot analysis showing the CHK2 protein level in CHEK2-KO versus control cells. b Representative colony growth images (upper panel) and quantification (lower panel) after treatment with olaparib in AAVS1 control and CHEK2-KO PCa cell lines as indicated. Data are presented as mean ± SD of three biologically independent replicates. The p-values were determined using one-way ANOVA. c Dose-response curves (left panel) after treatment with olaparib for AAVS1 control and CHEK2-KO C4-2B cell clones. Immunoblot analysis (right panel) showing the CHK2 protein level in CHEK2-KO and control cell clones. d Dose-response curves after treatment with rucaparib, talazoparib, veliparib, and carboplatin for AAVS1 control and CHEK2-KO C4-2B and 22Rv1 cells. In a, c, and d data are presented as mean ± SD (n = 3 biologically independent experiments). The immunoblot analyses were repeated independently twice with similar results. The p-values were determined by comparing CHEK2-KO to AAVS1 control cells using two-way ANOVA. Source data are provided as a Source Data file.

