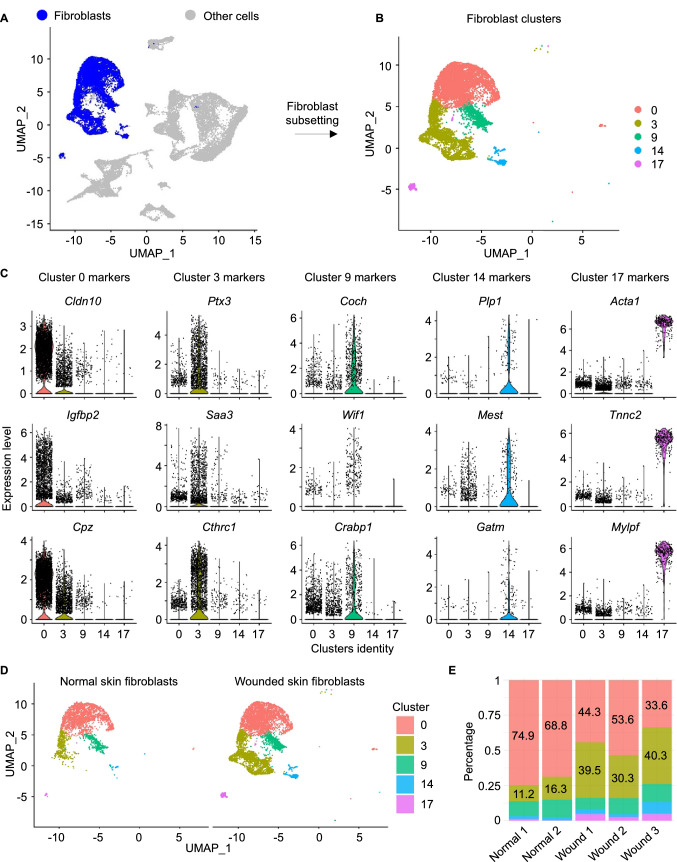
Figure 2.
Identification of distinct subsets of fibroblasts. (A) UMAP plot showing cells identified as fibroblasts or myofibroblasts in blue color and other cells in grey color. (B) Fibroblast clusters. (C) Top upregulated 3 genes in fibroblast clusters 0, 3, 9, 14 and 17. (D) UMAP plots showing cells identified as fibroblasts splitted by condition (normal skin: left panel and wounded skin: right panel). (E) Barplot representing percentage of each fibroblast cluster among the fibroblast population within each sample.

