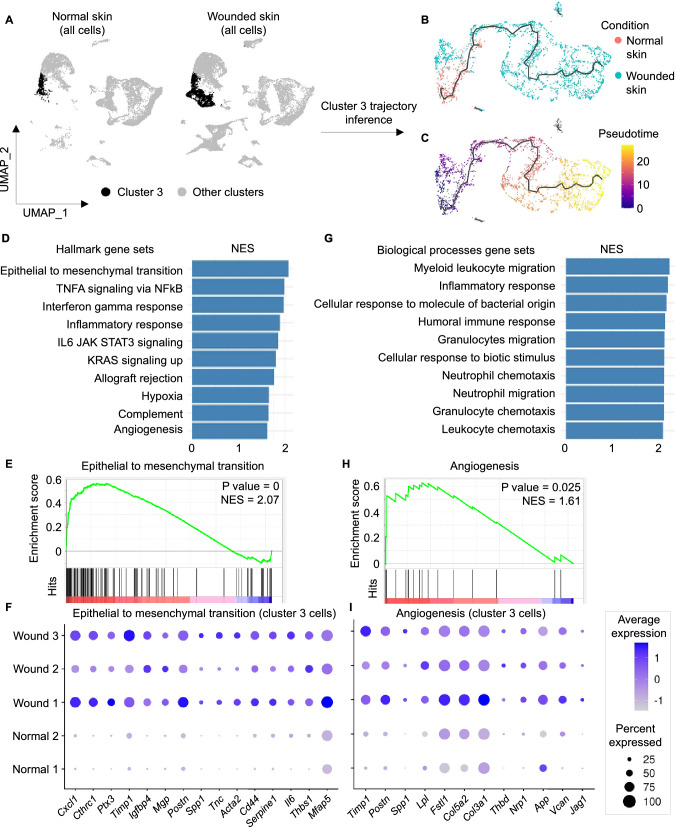
Figure 3.
Upregulation of EMT and angiogenesis in cluster 3 fibroblasts at day 4 post-wound in mice skin. (A) UMAP plot representing cluster 3 in a black color and other clusters in s grey color. (B, C) UMAP plots of cluster 3 cells colored by condition and pseudotime receptively. The black line represents the inferred trajectory. (D, G) Top 10 uppregulated hallmark and biological processes gene sets in cluster 3 in wounded skin compared to normal skin. Bars represent the normalized enrichment score (NES) of the gene set enrichment analysis. (E, H) GSEA enrichment plot for EMT and angiogenesis. Hits (black lines) represent the intersection between the DEGs and the enriched gene sets. (F, I) Dotplots representing relative expression level of the top upregulated genes having role in EMT and angiogenesis respectively with log2FC > 0.25 in cluster 3 during wound healing compared to cluster 3 in normal skin. Dot size represents percentage of cells within cluster 3 expressing the gene in each sample. Dot color represents the relative expression level of the gene.

