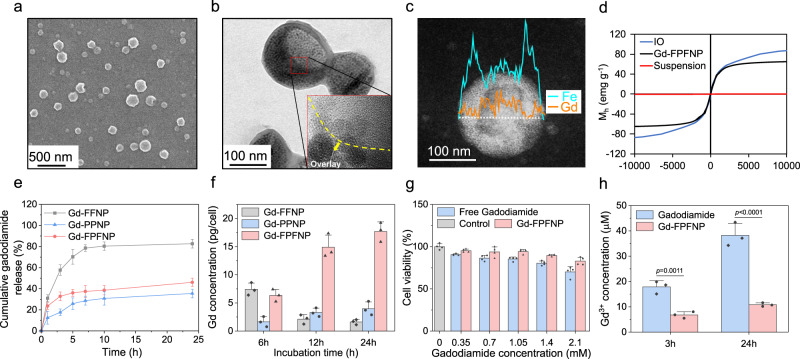
Fig. 2. Characterization of gadodiamide (Gd)-loaded fucoidan-based nanoparticles.
a SEM image of Gd-Fu@IO@PVA/Fu nanoparticle (Gd-FPFNP). b TEM image of Gd-FPFNP. Inset: high-resolution TEM image shows that superparamagnetic iron oxide nanoparticle (IO) was presented in the shell of Gd-FPFNP. c TEM line scan image and EDS analysis showed that Gd was encapsulated in the core of Gd-FPFNP. d The saturation of magnetization for IO and Gd-FPFNP was 84.7 and 73.5 emu g-1, respectively. e Cumulative gadodiamide release of Gd-Fu@IO@Fu nanoparticle (Gd-FFNP), Gd-PVA@IO@PVA nanoparticle (Gd-PPNP) and Gd-FPFNP in phosphate-buffered saline (PBS). The results were expressed as mean ± SD, n = 3 independent nanoparticles samples. f Gd concentration in umbilical cord mesenchymal stem cell (UMSC) after incubation with Gd-FFNP, Gd-PPNP and Gd-FPFNP for 6, 12, and 24 h (magnetic navigation was applied for 6 h). The results were expressed as mean ± SD, n = 4 independent UMSC samples. g Cell viability of UMSCs after the incubation with free gadodiamide and Gd-FPFNP for 24 h. The results were expressed as mean ± SD, n = 4 independent UMSC samples. The p values between free gadodiamide and Gd-FPFNP at the concentration of 0.35, 0.7, 1.05, 1.4 and 2.1 mM are 0.0053, not significant (ns, p > 0.05), 0.0025, 0.0007 and 0.0168, respectively. h Release of Gd3+ from free gadodiamide and Gd-FPFNP in culture medium. The results were expressed as mean ± SD, n = 3 independent nanoparticles samples. P values between free gadodiamide and Gd-FPFNP at 3 h and 24 h are 0.0011 and low than 0.0001, respectively. Statistical analysis in g and h was performed by Graph Pad Prism 9.0 Software using two-sided t-test compared with free gadodiamide.

