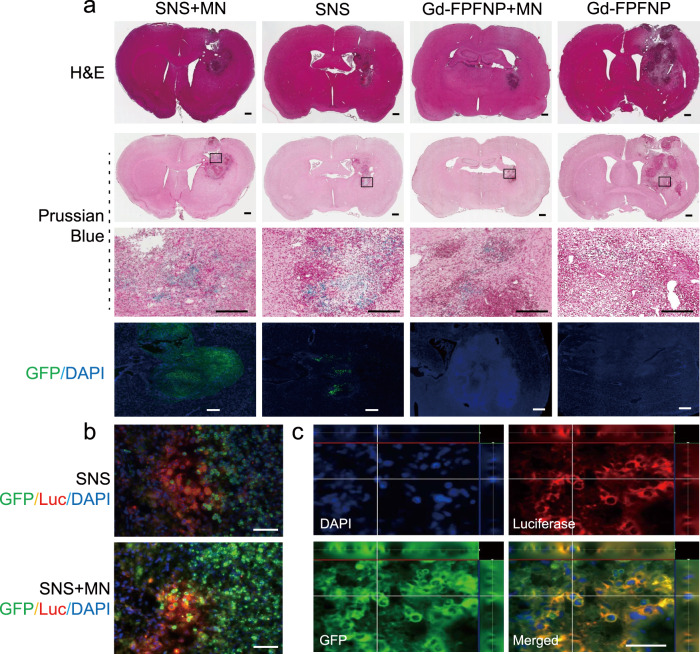
Fig. 3. Distribution of stem cell–nanoparticle system (SNS) and Gd-Fu@IO@PVA/Fu nanoparticle (Gd-FPFNP) in the tumor tissues of F98 tumor-bearing rats.
a H&E staining (lane 1) and Prussian blue staining (lane 2) of the brains at 24 h post treatment with SNS plus magnetic navigation (MN), SNS, Gd-FPFNP plus MN, and Gd-FPFNP. Scale bar = 500 μm. GBM area framed in the in lane 2 was magnified in the high-power field (lane 3, scale bar = 500 μm). Lane 4 was the fluorescent staining of same region (GFP represented SNS, DAPI represented nuclei, scale bar = 50 μm). The study was performed with n = 3 rats. The images in lanes 1–4 are representative of at least 3 other images. GFP green fluorescent protein. b Immunofluorescent images of tumor tissues from luciferase-expressing F98 (F98-Luc)-tumor-bearing rats. The rats were treated with SNS plus MN or SNS alone. UMSCs were modified with GFP. Nuclei were stained using DAPI. Luc luciferase. Scale bar = 50 μm. The study was performed with n = 3 rats and the images are representative of 4 images. c Colocalization of GFP+ UMSCs (green) with F98-Luc cells (red) over the striatal area at 24 h post injection of SNS with MN in the F98-Luc GBM rat model. Scale bar = 50 μm. The study was performed with n = 3 rats and the images are representative of 4 images.

